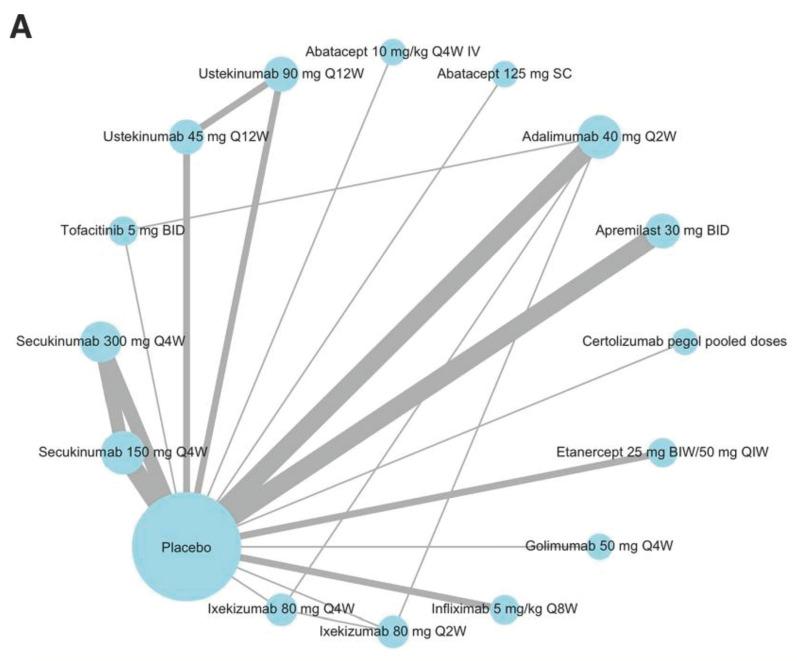
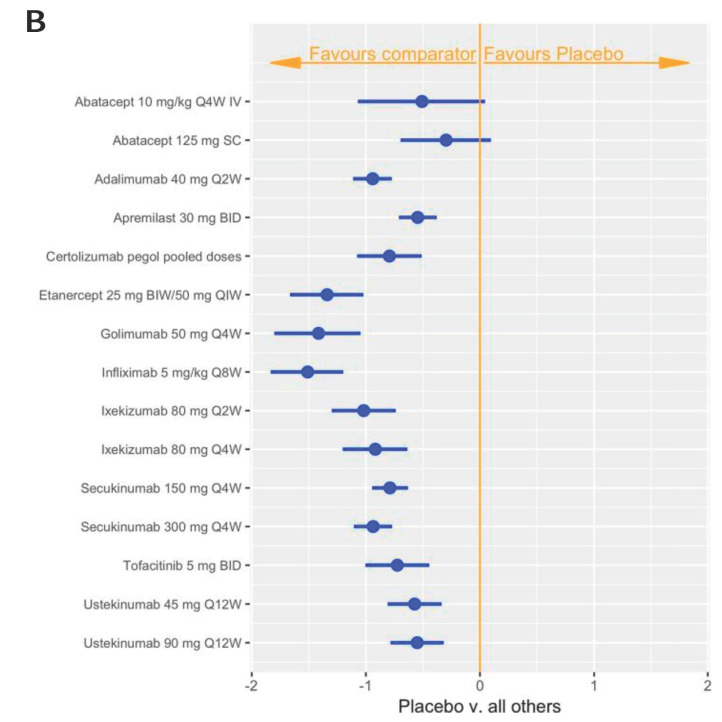
Figure 1.
Network diagram [30] The network diagram (A) and forest plot (B) were configured based on the American College of Rheumatology (ACR) standard scale to illustrate treatment responses after 12–16 weeks of use in patients with active PsA who had never received prior treatment with a biologic DMARD. This figure was adapted with permission from RMD Open 2020;6:e001117. doi: 10.1136/rmdopen-2019-001117 [30].


