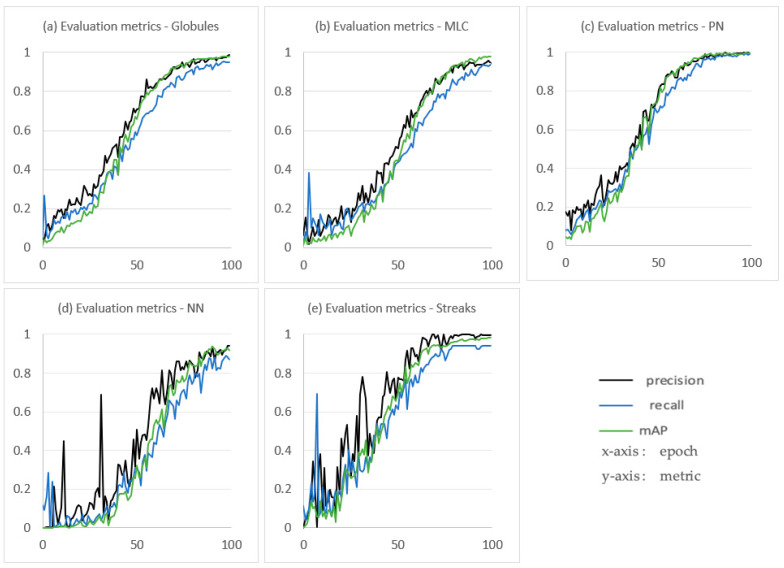
Figure 9.
Performance measures of the models on training step. (a), (b), (c), (d) and (e), respectively, represent the performance metrics of the globule localization model, the milia-like cyst (MLC) localization model, the pigment network (PN) localization model, the negative network (NN) localization model, and the streak localization model. The epoch number is on the x-axis and the metric value (precision, recall, or mAP) is on the y-axis.

