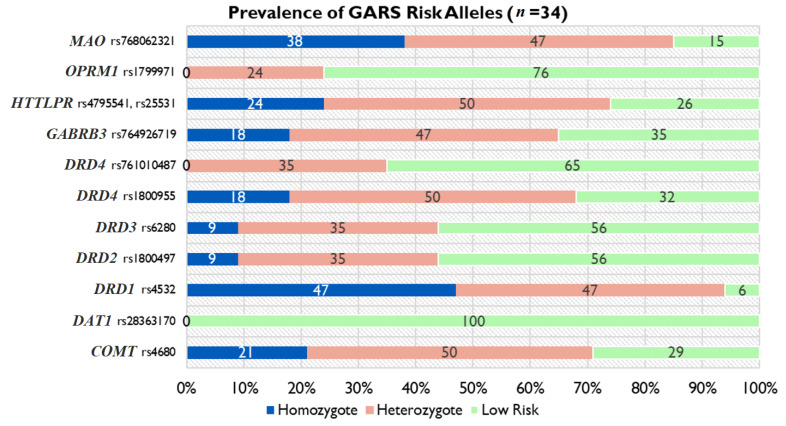
Figure 1.
GARS results represented as the percent frequency of gene type for each risk allele analyzed within the patient population (n = 34). The homozygote category represents having two copies of the risk allele, heterozygous represents one copy of the risk allele, and the low-risk category represents no copies of the risk allele per gene.

