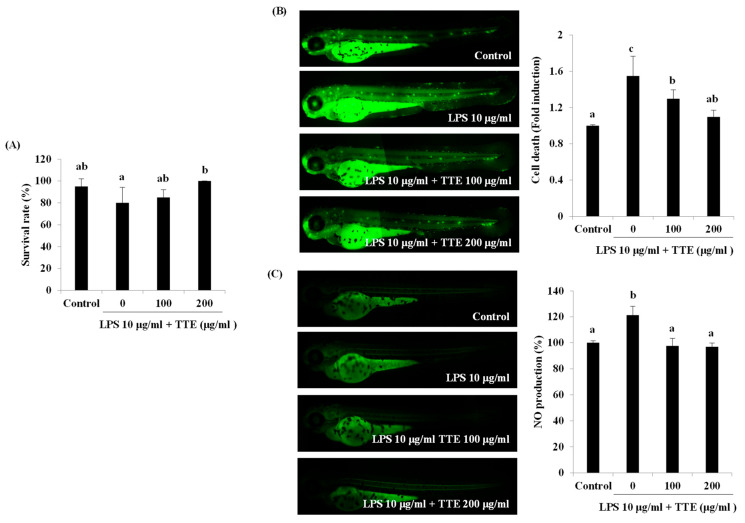
Figure 4.
Inhibitory effect of TEE on LPS-stimulated cell death and NO production in a zebrafish model. (A) Survival rate was evaluated by counting the number of surviving zebrafishes at 7 dpf. (B) Cell death was analyzed using acridine orange staining. (C) NO production was measured using DAF-FM-DA staining. Quantitative analysis of fluorescence was performed using ImageJ software (version 1.46r). The data are expressed as the mean ± standard deviation of triplicate experiments. a–c Values with superscript letters differed significantly (p < 0.05, by Duncan’s multiple rages test).

