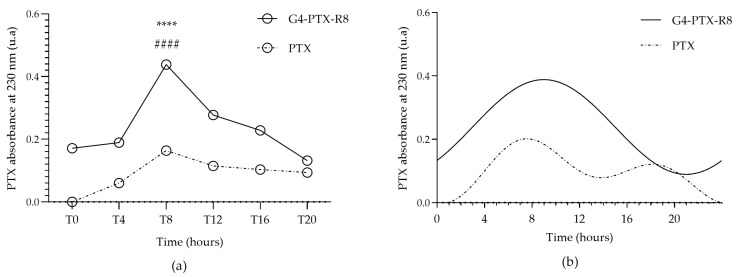
Figure 6.
Quantification of cell-associated PTX absorbance. The absorbance of PTX was measured 6 h after the cells were incubated with either free PTX or the G4-PTX-R8 dendrimer complex, at the considered time points (a). Each point represents the mean value calculated with the data obtained from independent measurements (n = 3, mean ± SD), which were then analyzed by two-way ANOVA followed by Bonferroni test. A higher absorbance of PTX was noticed for G4-PTX-R8 at T8 and this difference was considered statistically significant in relation to other time points (**** p < 0.0001). Furthermore, the difference in PTX values was also statistically significant between free PTX and the G4-PTX-R8 dendrimer complex for T8 (#### p < 0.0001). Circadian oscillations were considered significant for both free PTX and the G4-PTX-R8 complex after the analysis with CircWave (p < 0.001) (b).

