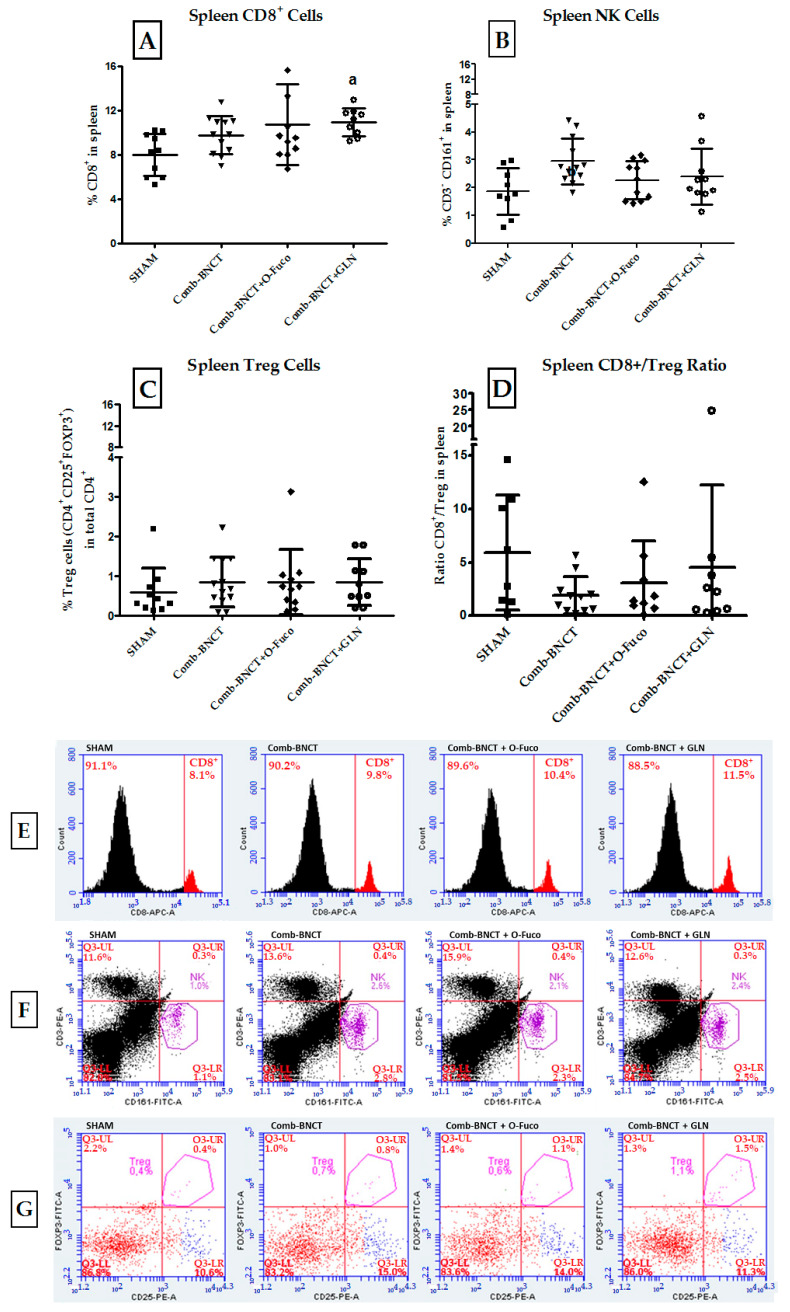
Figure 11.
Evaluation of immune cell populations in spleen. (A) Percentage of CD8+ cells in the spleen, a = p ≤ 0.01. (B) Percentage of NK cells (CD3−CD161+) in the spleen. b = p ≤ 0.05 vs. SHAM. (C) Percentage of Treg cells (CD4+CD25+FOXP3+) in the spleen. (D) CD8/Treg ratio in spleen. Representative flow cytometry graphs of splenocytes. (E) Histograms show the percentage of CD8+ cells in total splenocytes. (F) Dot plots show NK cells (CD161+CD3−) in total splenocytes. (G) Dot plots show Treg cells (CD4+CD25+FOXP3+) in total CD4+ from spleen.

