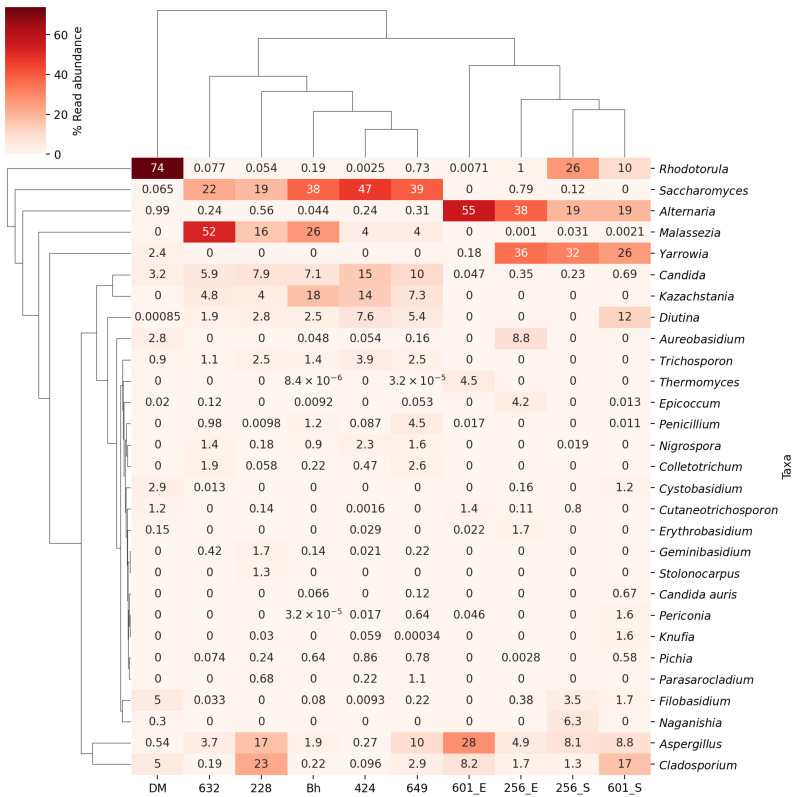
Figure 1.
Heatmap showing the distribution of the 28 most common fungal genera in ear and skin samples from seven dogs and one healthcare worker. Different intensities of colours represent the percent read abundance of a genus in each sample. The dendrogram on the left is to indicate the similarity between different genera based on their read abundance profiles. Genera that are closer together on the dendrogram share more similar abundance patterns in our samples. The dendrogram on the top represents the clustering and relationships between the different samples based on their read abundance profiles of listed genera. Samples that are closer together on the dendrogram share more similar read abundance profiles.

