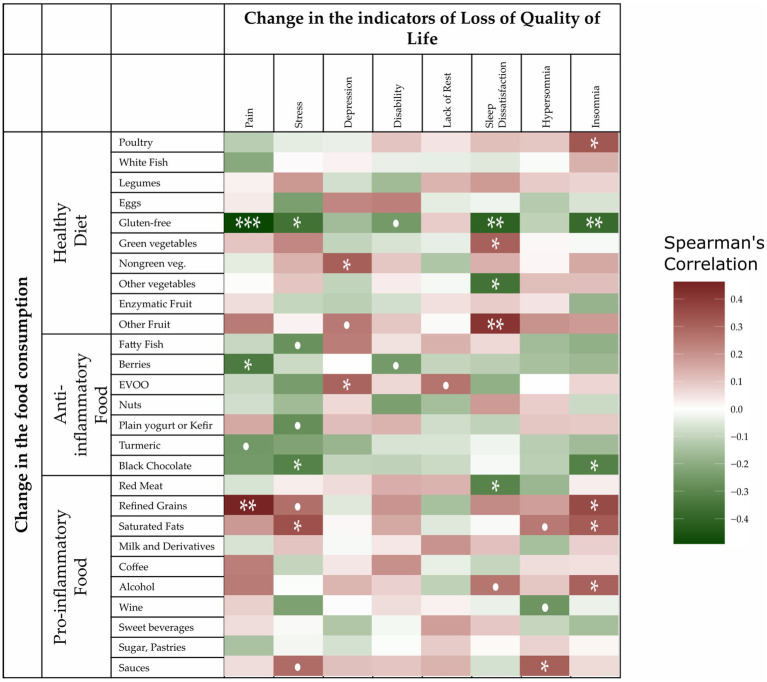
Figure 3.
Spearman rank correlations of the change in the consumption of foods according to the nutritional score and changes in the quality of life (QoL) indicators. All the scores were scaled so that a deterioration in QoL implied an increased value. The “pain,” “stress,” and “lack of rest” characteristics were measured with a numerical rating scale; “depression” was measured with the Geriatric Depression Scale (GDS); “disability” with the Health Assessment Questionnaire (HAQ); and “insomnia,” “hypersomnia,” and “dissatisfaction” corresponded to the same items in the Oviedo Sleep Questionnaire (OSQ). Specifically, we considered sleep dissatisfaction and lack of rest rather than satisfaction and rest. Negative correlation values for food/indicator pairs were shaded in green and represent improvements in patient QoL. Conversely, positive correlation values were shaded in red and represented a deterioration in the quality of life. •p < 0.1, *p < 0.05, **p < 0.01, and ***p < 0.001.

