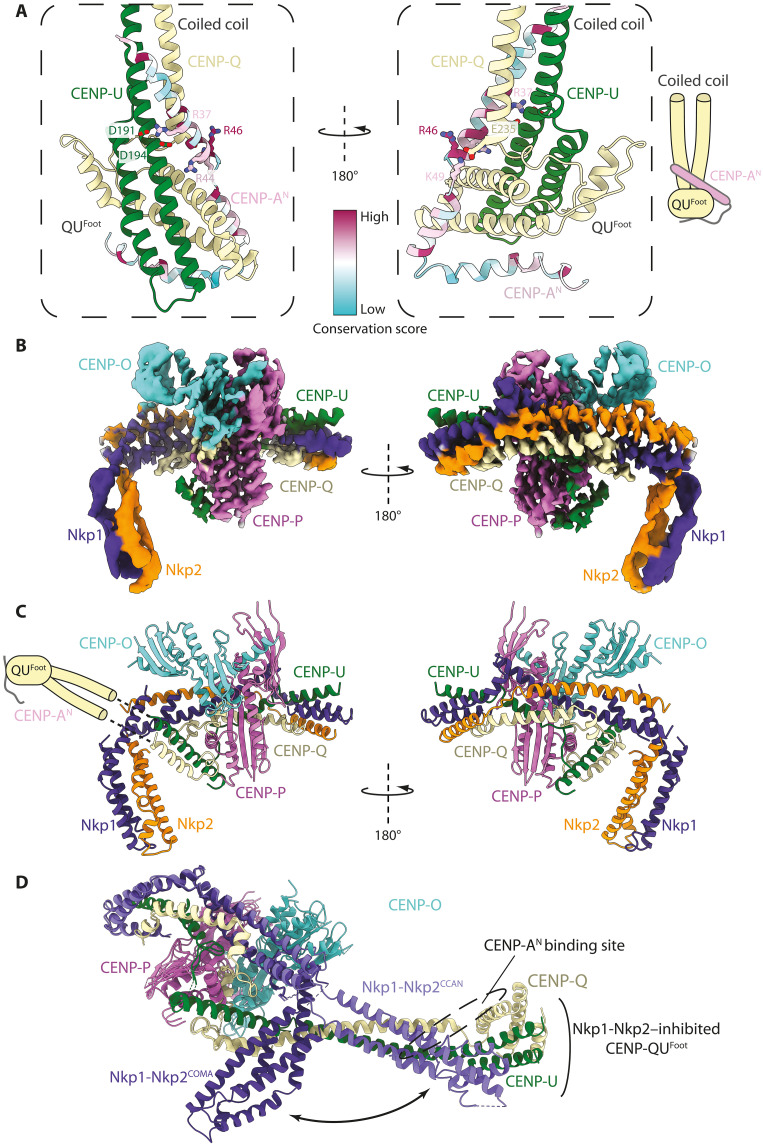
Fig. 4. CENP-AEND interacts with CENP-QU autoinhibited by CCAN.
(A) Two views of an AlphaFold2 model predicting how CENP-AN interacts with CENP-QU. The major site of interaction involves CENP-AEND with CENP-QUFoot and CENP-QU coiled coil. CENP-AN is colored with a sequence conservation score. (B) Cryo-EM map of the CENP-AN:CENP-OPQU+ (COMA) complex. (C) Ribbons representation of the COMA complex. In this structure, the CENP-QUFoot and adjacent coiled coil, including the CENP-AEND binding site of CENP-QU, are mobile and not visible in the cryo-EM map. These are shown schematically. (D) Structure of CENP-OPQU+ in the context of CCAN superimposed onto the COMA complex. This shows the conformational change of the N-terminal region of Nkp1-Nkp2 exposing the CENP-AEND binding site on CENP-QU (mobile) in the free CENP-OPQU+ complex (movie S2).

