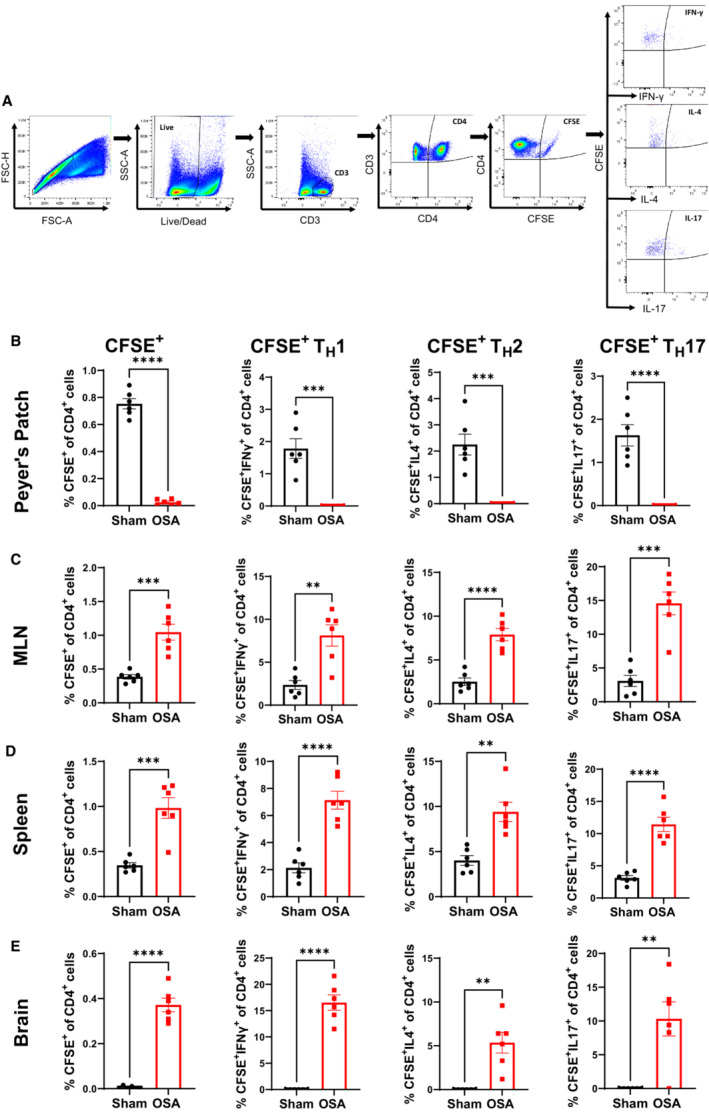
Figure 6. Immune cells originating from the gut migrate to the periphery and brain following OSA.

Flow cytometry gating strategy to identify CFSE+ immune cells (A). Percentage of CD4+, TH1, TH2, and TH17 CFSE‐labeled cells in Peyer's patches (B), MLN (C), spleen (D), and brain (E) of sham and OSA rats. n=6 per group; **P<0.005, ***P<0.0005, ****P<0.0001 using 2‐tailed Student's t‐test. Error bars represent ±SEM. CFSE indicates carboxyfluorescein succinimidyl ester; FSC‐H, forward scatter; MLN, mesenteric lymph node; OSA, obstructive sleep apnea; SSC‐A, side scatter; and TH, T helper cell.
