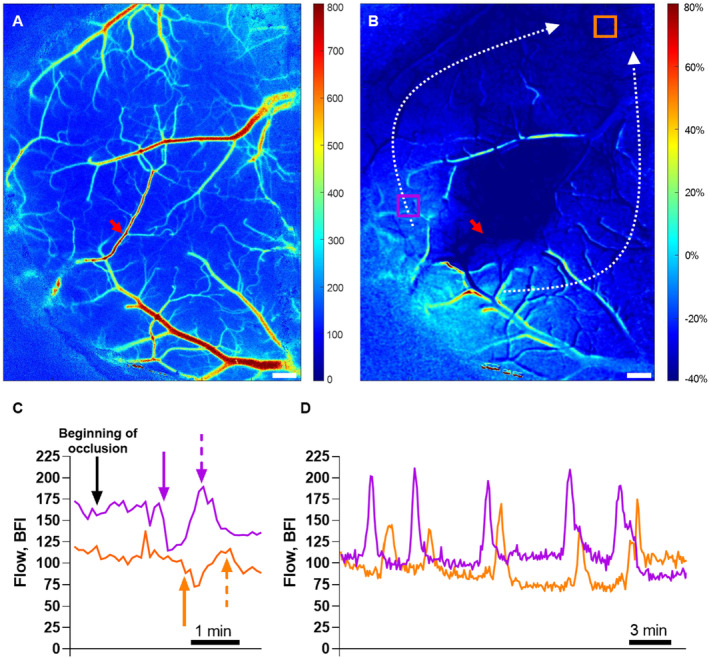
Figure 2. Spreading depolarizations were elicited by cerebral ischemia.

A, Representative laser speckle contrast image (LSCI) at baseline. B, Ratio of LSCI before vs during the occlusion identified the ischemic region. Dotted white arrows show the propagation of spreading depolarizations that were initiated from the lateral part of the penumbral cortex (B; see also Video S1). Two regions of interest (ROIs) were placed just outside the ischemic core (violet) and in the peri‐ischemic area (orange; B). Bars, 300 μm; red arrows indicate the photothrombosis focus point (A, B). Representative traces from these 2 ROIs at the beginning of occlusion (C) and 25 to 50 minutes after initiation of the occlusion (D). The black arrow indicates the time when the middle cerebral artery occlusion started (C). Approximately 2 minutes after the occlusion, the first spreading depolarization propagated. The solid violet and orange arrows show the beginning of the hypoperfusion whereas the dotted arrows indicate the subsequent hyperperfusion followed by sustained hypoperfusion (C). During this global hypoperfusion, several spreading depolarizations propagated and were associated with waves of hyperperfusion (D). The delayed changes in blood flow in the area corresponding to the orange ROI are caused by spreading depolarization propagation. See Table S2 for details about the spreading depolarizations. BFI indicates blood flow index.
