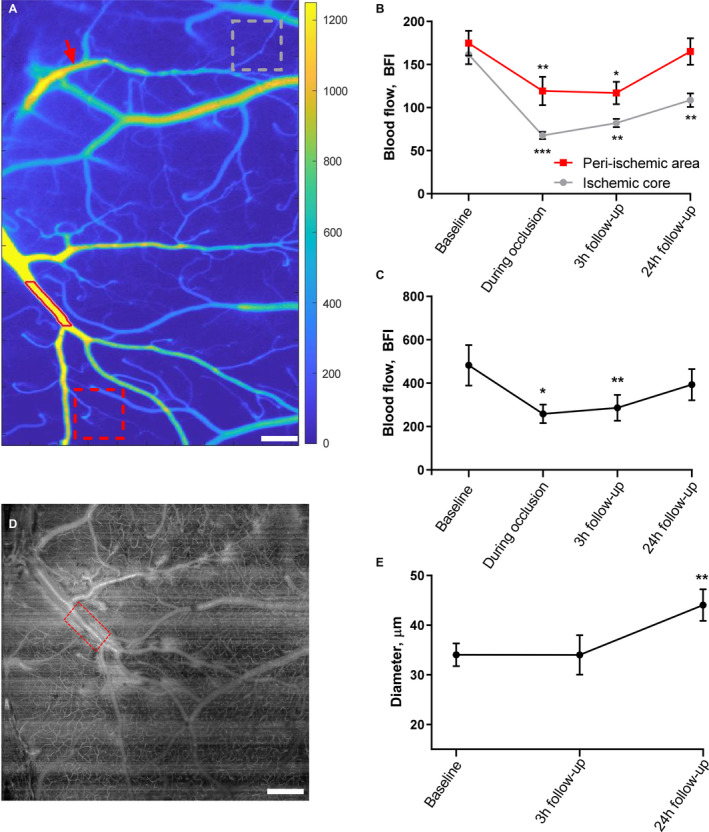
Figure 4. Cerebral perfusion was globally reduced 3 hours after ischemia–reperfusion but returned to baseline after 24 hours.

A, Tissue perfusion was measured by laser speckle contrast imaging. Regions of interest for tissue perfusion (gray and red dotted boxes in the ischemic core and peri‐ischemic area, respectively) and the vessel segmentation (lumen outlined by red line) of the middle cerebral artery (MCA) branch neighboring to the occluded artery are shown. Red arrow indicates the focus point for photothrombosis. Bar=300 μm. B, Tissue perfusion was globally reduced 3 hours after ischemia reperfusion in both the ischemic core and the peri‐ischemic area (data points for baseline and during occlusion are also shown in Figure 1E). At the 24‐hour follow‐up, the tissue perfusion of the peri‐ischemic area returned to a level similar to the perfusion observed at baseline. C, Blood flow in the MCA branch supplying the peri‐ischemic area was reduced during the occlusion of the anterior MCA branch and at the 3‐hour follow‐up but was not statistically different from baseline at the 24‐hour follow‐up. D, Representative optical coherence tomography (OCT) angiogram showing the segment (red box) of the MCA branch neighboring to the occluded artery; same MCA segment as in A. Bar=400 μm. E, The diameter of the neighboring MCA branch was assessed from this angiogram and revealed vasodilation at the 24‐hour follow‐up. The MCA diameter was evaluated in absolute values and compared with the baseline using mixed‐effects analysis. Error bars=SE. Blood flow (B and C) was compared with baseline using 1‐way ANOVA followed by Dunnett's multiple comparisons tests. Two separate analyses were conducted to evaluate the change in blood flow compared with baseline in the peri‐ischemic cortex and the ischemic core (B). *P<0.05, **P<0.01, ***P<0.001; n=6. BFI indicates blood flow index.
