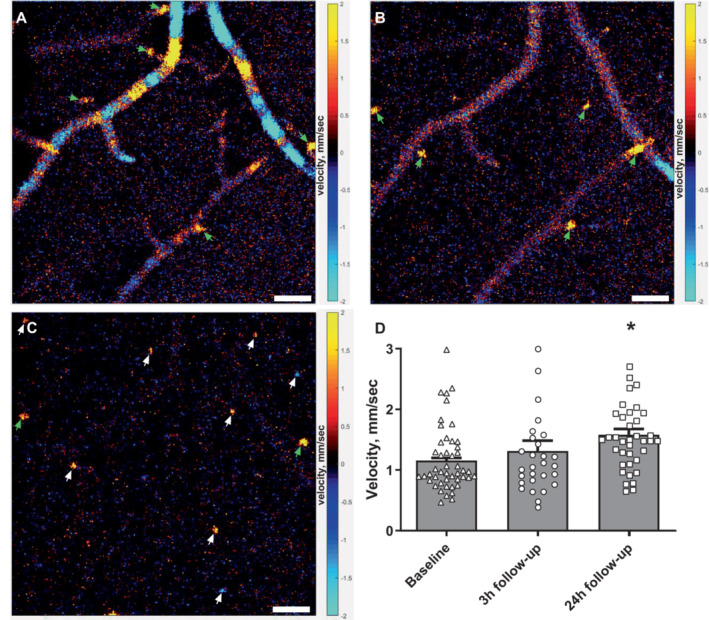
Figure 6. Capillary flow velocity was increased at the 24‐hour follow‐up.

Representative phase‐resolved Doppler optical coherence tomography images obtained 33, 53, and 180 μm from the brain surface (A–C, respectively). Pial arteries/veins can be seen on the brain surface, and penetrating arterioles/venules (green arrows) and capillaries (white arrows) are seen in deeper layers of the cortex in a vertical direction. Bars, 50 μm (A–C). Red/yellow and blue/turquoise colors indicate ascending and descending flow, respectively. D, The weighted average capillary flow velocity was similar 3 hours after reperfusion but increased at the 24‐hour follow‐up compared with that observed at baseline. Error bars=SE. Measurements from capillaries for each mouse at each time point were averaged and plotted as a bar graph. Individual capillary velocity measurements from all mice are plotted on top of bar graphs. The weighted average of capillary flow velocities at the 2 follow‐up time points were compared with baseline using repeated measures 1‐way ANOVA followed by Dunnett's multiple comparisons test. *P<0.05 n=6, measurements from 47, 28, and 37 individual capillaries at baseline, 3‐hour, and 24‐hour follow‐up, respectively.
