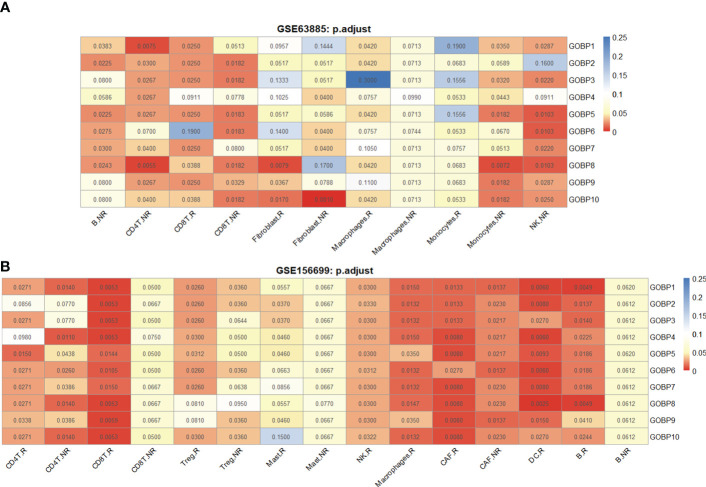
Figure 2.
The DE gene lists from different cell types were associated with chemotherapy response prediction. (A) Performance of 11 DE gene lists from the GSE154600 dataset in predicting chemotherapy response outcomes. (B) Performance of 11 DE gene lists from the GSE154600 dataset in predicting chemotherapy response results. All data for the computational processes can be obtained in detail from Extended Data 1. Chemotherapy response results: R, responders; NR, nonresponders. AUC p-values were FDR-adjusted by the Benjamini–Hochberg method.

