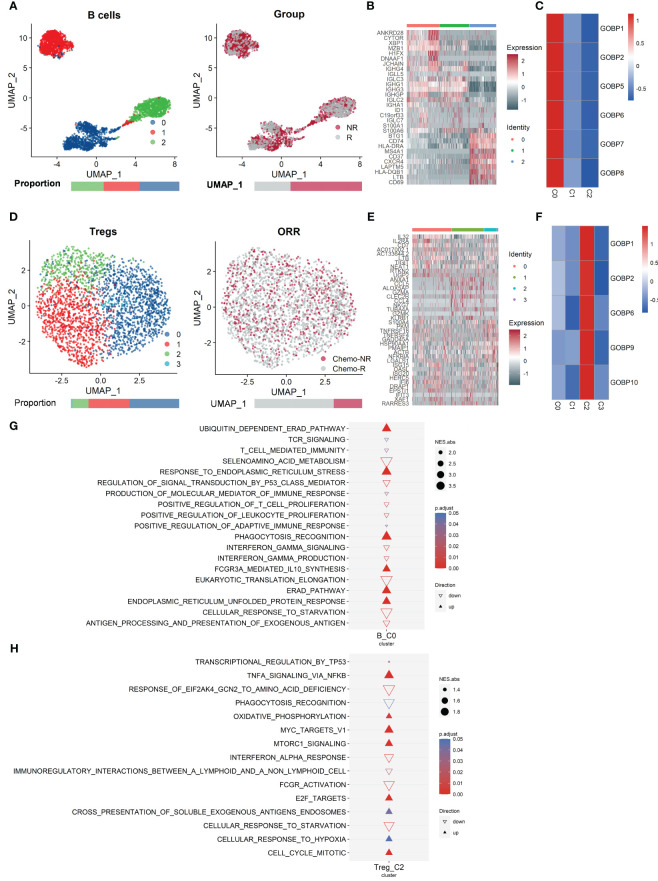
Figure 3.
Analysis of the single-cell RNA sequencing dataset GSE154600 versus GSE165897 revealed that B cells from GSE154600 and Tregs from GSE165897 were enriched in nonresponders. (A) UMAP plot of B cells from GSE154600. B cells were further divided into three clusters containing two different chemotherapy response outcomes, R and NR. Bar graphs show the proportion of cells sorted by clusters (left) and chemotherapy response (right). (B) Heat map of standardized expression of the top 10 specific marker genes of each B-cell subpopulation of GSE154600 as determined by bilateral Wilcoxon rank sum test and FDR correction (p < 0.05). (C) Expression of GOBP gene sets with significant (p < 0.05) predictive power was localized by gene set variance analysis (GSVA) to identify B-cell subtypes associated with chemotherapy response prediction. (D) UMAP plot of Tregs from GSE165897. Tregs were further divided into four clusters containing two different chemotherapy response outcomes, Chemo-R and Chemo-NR. The bars show the proportion of cells sorted by clusters (left) and chemotherapy response (right). (E) Heat map of standardized expression of the top 10 specific marker genes of each Treg cell subpopulation of GSE165897 as determined by bilateral Wilcoxon rank sum test and FDR correction (p < 0.05). (F) Expression of GOBP gene sets with significant (p < 0.05) predictive power was localized by gene set variance analysis (GSVA) to identify Treg cell subtypes associated with chemotherapy response prediction. (G, H) Results of GOBP, Hallmark, KEGG, and Reactome enrichment analyses of the C0 subpopulation of B cells (G) from GSE154600 and the C2 subpopulation of Tregs (H) from GSE165897.

