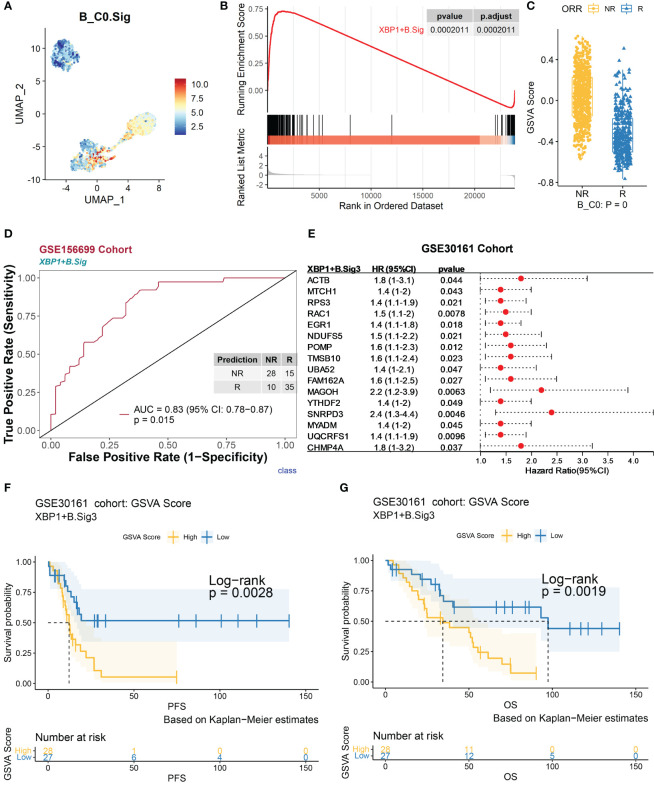
Figure 4.
Validation of marker genes for XBP1+ B using an independent bulk RNA sequencing dataset. The scRNA-seq datasets GSE154600, GSE156699, and GSE30161 of B cells were analyzed. (A) Characterization plots of GSVA scores show that XBP1+ B.Sig can specifically characterize the B-cell C0 subcluster. (B) GSEA shows that XBP1+ B.Sig is significantly enriched in NR cells of the B-cell C0 subcluster. FDR adjustment of p-values was performed using the FDR method. (C) By GSVA analysis, the boxplot shows that the NR GSVA score of XBP1+ B.Sig is significantly higher than R in the B-cell C0 cluster. Box limits, upper and lower quartiles. Center line, median. Whiskers, 1.5 interquartile range. Points beyond whiskers, outliers. A two-sided Wilcoxon test was used to determine significance. (D) Prediction ability performance of XBP1+ B.Sig with 260 chemotherapy response markers in the GSE156699 cohort. (E) Univariate Cox regression analysis of genes with significant enrichment of XBP1+ B.Sig in NR cells of the B-cell C0 subcluster (XBP1+ B.Sig2) obtained from the GSEA results of XBP1+ B.Sig (B), resulting in genes with higher prognostic risk (HR > 1) and higher significance (p < 0.05) of prognosis-related genes (XBP1+ B.Sig3) and visualized as in (F). (G) Survival analysis of GSVA scores of XBP1+ B.Sig in the GSE30161 cohort (55 patients, R = 54, NR = 1). Groups were dichotomized according to median GSVA, and significance was determined using the log-rank test. Dashed line: median survival time. Color range: 95% confidence interval (CI).

