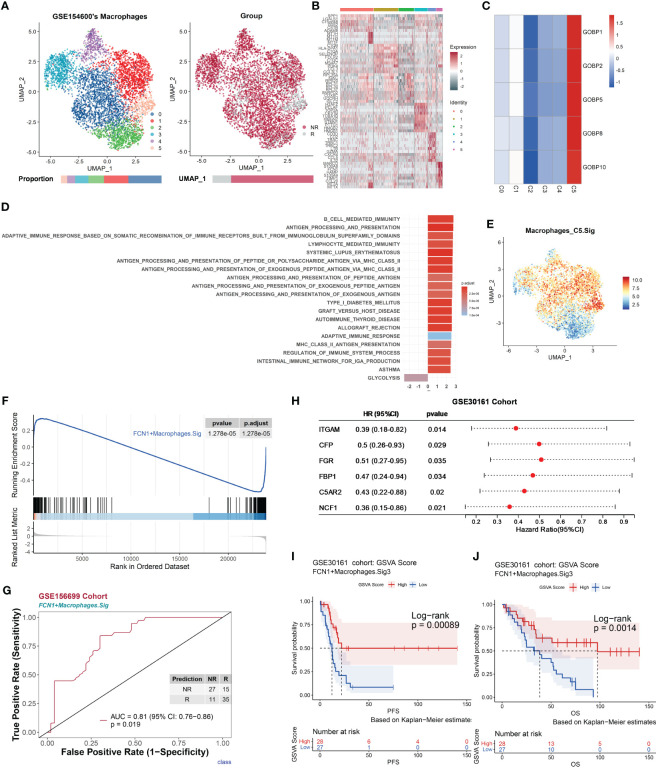
Figure 5.
Macrophages promote antitumor immune responses, correlate with chemotherapy response, and are validated by an independent bulk RNA dataset. The scRNA-seq dataset GSE154600 of macrophages and the GSE156699 and GSE30161 cohorts were analyzed. (A) UMAP plot of macrophages from GSE154600. Macrophages were further divided into six clusters containing two different chemotherapy response outcomes, R and NR. Bar graphs show the proportion of cells sorted by clusters (left) and chemotherapy response (right). (B) Heat map of standardized expression of the top 10 specific marker genes of the macrophage-cell subpopulation of GSE154600 as determined by bilateral Wilcoxon rank sum test and FDR correction (p < 0.05). (C) Expression of GOBP gene sets with significant (p < 0.05) predictive power was localized by gene set variance analysis (GSVA) to identify macrophage-cell subtypes associated with chemotherapy response prediction. (D) Results of GOBP, Hallmark, KEGG, and Reactome enrichment analyses of the C5 subpopulation of macrophages from GSE154600. (E) Characterization plots of GSVA scores show that FCN1+ Macrophages.Sig can specifically characterize macrophage-cell C5 subclusters. (F) GSEA shows that FCN1+ Macrophages.Sig was significantly enriched in NR cells of the macrophage-cell C5 subcluster. FDR adjustment of p-values was performed using the FDR method. (G) Prediction ability performance of FCN1+ Macrophages.Sig with 260 chemotherapy response markers in the GSE156699 cohort. (H) Univariate Cox regression analysis of genes with significant enrichment of FCN1+ Macrophages.Sig in R cells of the macrophage-cell C5 subcluster (FCN1+ Macrophages.Sig2) obtained from the GSEA results of FCN1+ Macrophages.Sig (F), resulting in genes with higher prognostic risk (HR < 1) and higher significance (p < 0.05) of prognosis-related genes (FCN1+ Macrophages.Sig3), and visualized as in (I). (J) Survival analysis of GSVA scores of FCN1+ Macrophages.Sig3 in the GSE30161 cohort (n = 55, R = 54, NR = 1). Groups were dichotomized according to median GSVA, and significance was determined using the log-rank test. Dashed line: median survival time. Color range: 95% confidence interval (CI).

