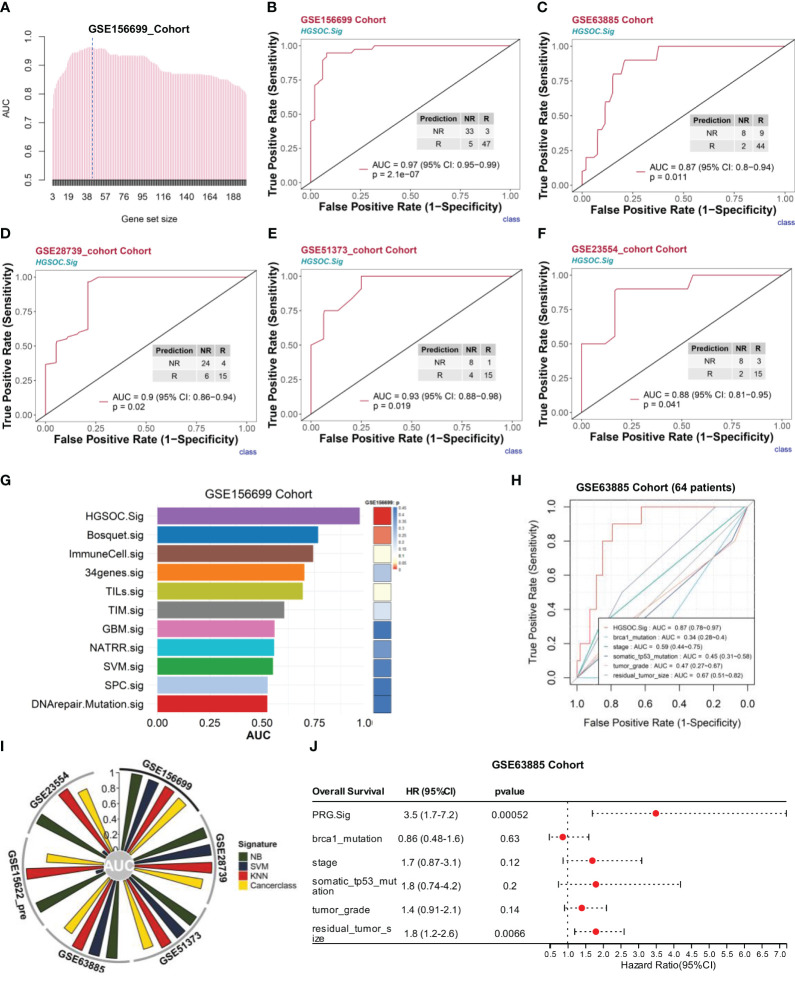
Figure 6.
HGSOC.Sig can effectively predict the outcome of chemotherapy response in HGSOC patients. The bulk RNA-seq datasets GSE156699 (n = 88, R = 50, NR = 38), GSE63885 (n = 63, R = 53, NR = 10), GSE28739 (n = 50, R = 20, NR = 30), GSE51373 (n = 28, R = 16, NR = 12), GSE15622_Pre (n = 35, R = 22, NR = 13), and GSE23554 (n = 28, R = 18, NR = 10) were analyzed. (A) The bar graph shows the AUC of gene combinations and the maximum AUC per cycle (different gene number combinations). Dotted line: 43-gene combination - HGSOC.Sig. (B) HGSOC.Sig had a high ability to predict chemotherapy response effects in the GSE156699 cohort. (C–F) Good predictive ability of HGSOC.Sig in predicting chemotherapy response outcomes for the GSE63885 cohort (C), GSE28739 cohort (D), GSE51373 cohort I, and GSE23554 (F). (G) Comparison of the performance (AUC vs. p-values) of HGSOC.Sig with the other 10 chemotherapy response signatures in the GSE156699 cohort. (H) Comparison of HGSOC.Sig with other clinical signatures in the GSE63885 cohort. (I) Verification of HGSOC.Sig using three other machine algorithms. SVM, support vector machine; NB, naïve Bayes; KNN, k-nearest neighbors. (J) Univariate regression analysis of HGSOC.Sig, and other clinical characteristics.

