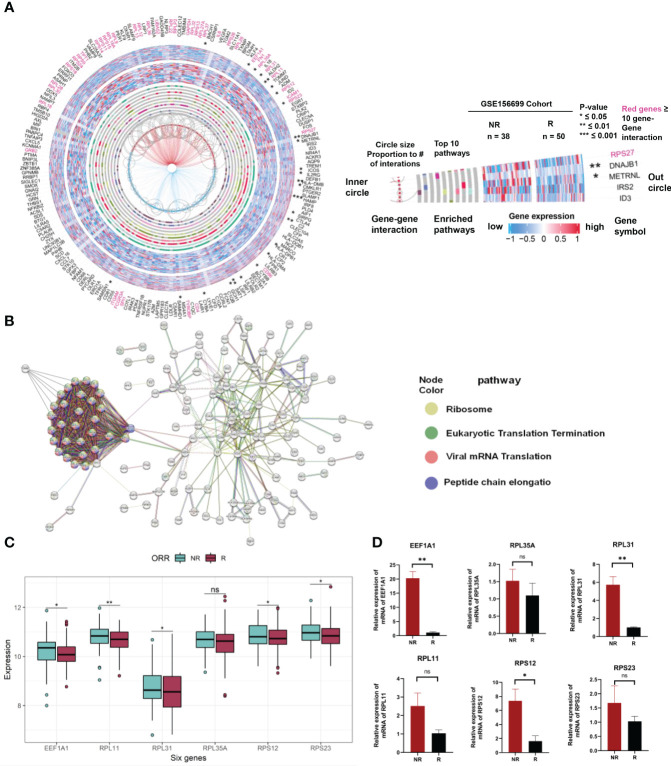
Figure 7.
Expression and interaction analysis of 201 genes related to chemotherapeutic response prediction. (A) Integrating gene expression profiles, pathway enrichment analysis, and gene interactome information of differentially expressed genes between 201 chemotherapy responsive and non-responsive ovarian cancer patients associated with chemotherapy response in a circular plot. Gene symbols are listed in the outermost circles, followed by statistical significance (stars), gene expression profiles in chemo responders (external heat map of 50 samples) and chemo nonresponders (internal heat map of 38 samples), the top 10 enrichment pathways (gray circles with colored bars indicating genes found in these pathways in the dataset), hub genes (red gene names with ≥ 10 interactions with other genes in the dataset), and gene–gene interactions (circle size proportional to the number of interactions). (B) PPI network showing the interactions of the 201 genes (interaction score = 0.7). PPI, protein–protein interaction. (C) Expression of EEF1A1, RPL35A, RPL31, RPL11, RPS12, and RPS23 in Merge cohort (containing GSE15622, GSE63885, GSE51373, GSE23554, GSE28739, and GSE156699). (D) Expression of EEF1A1, RPL35A, RPL31, RPL11, RPS12, and RPS23 in OV tumor tissues of chemotherapy responders and nonresponders by qRT-PCR. * represents p < 0.05, ** represents p < 0.01, *** represents p < 0.001, and ns indicates no significance.

