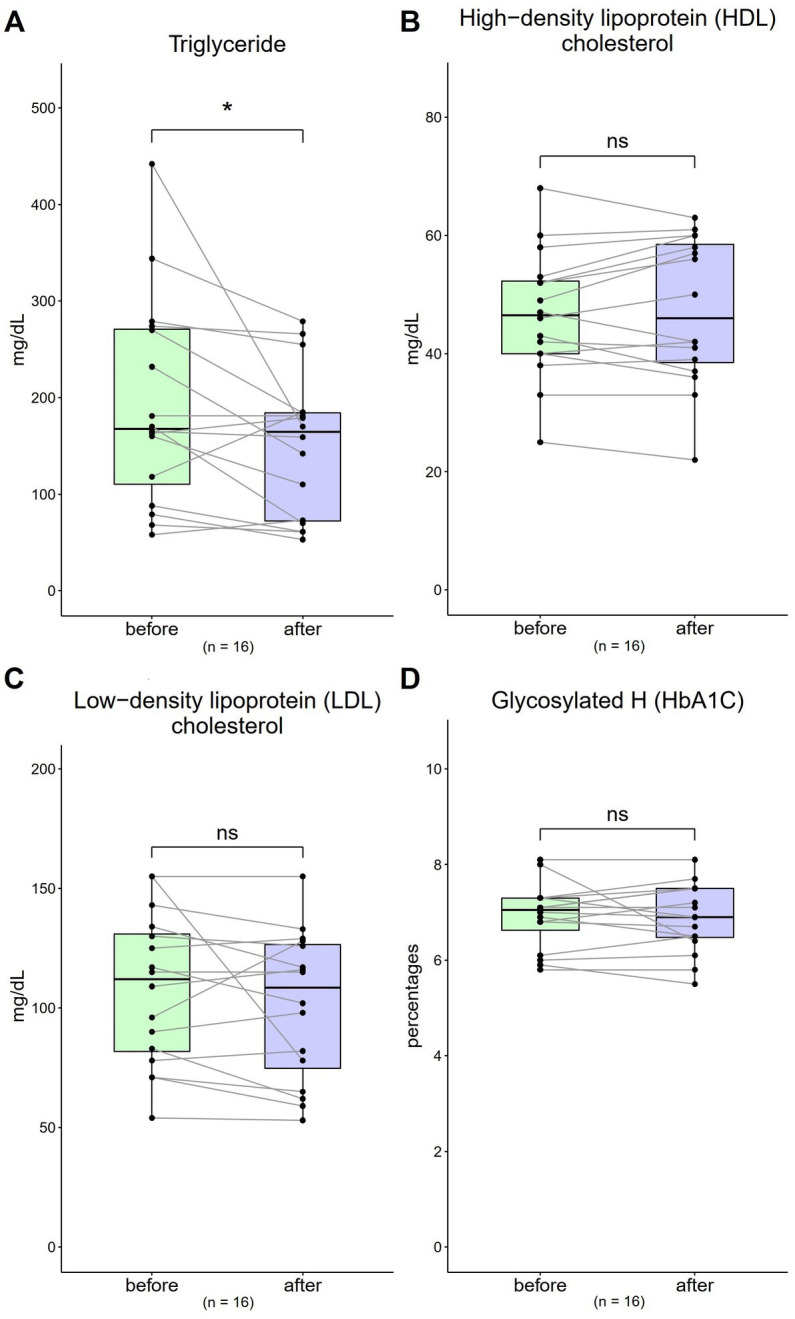
Figure 2.

Changes in triglyceride (TG), high-density lipoprotein cholesterol (HDL-C), low-density lipoprotein cholesterol (LDL-C), and haemoglobin A1c (HbA1c) levels from 0 to 4 weeks (n = 16). (A,C) The normal ranges are <150 mg/dL and <130 mg/dL for TG and LDL-C, respectively. (B) The normal range for HDL-C is >40 mg/dL. (D) The normal range of HbA1c is 4.0–6.0%. Data are represented by line plots (*p < 0.05; **p < 0.01; ***p < 0.001) and were analyzed using the paired t test.
