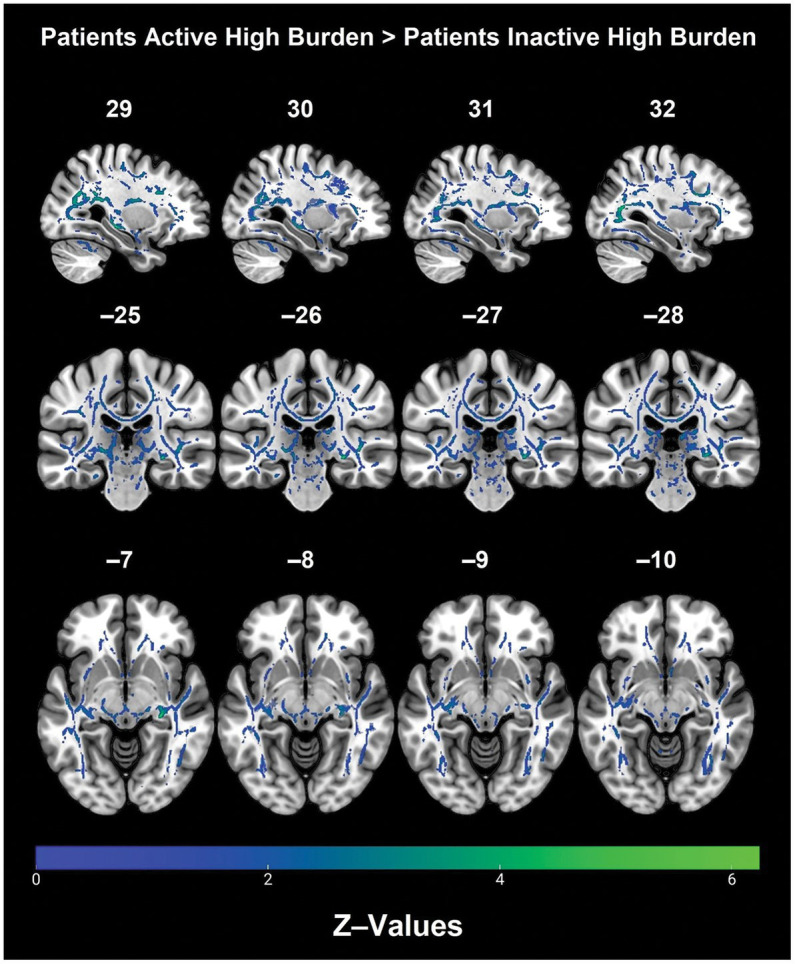
Figure 2.

Regions with significantly higher FA in the physically active patients with high vascular burden as compared with non-physically active patients with high vascular burden. (TFCE). A Bonferroni correction was applied (p < 0.0125) to correct for multiple comparisons.
