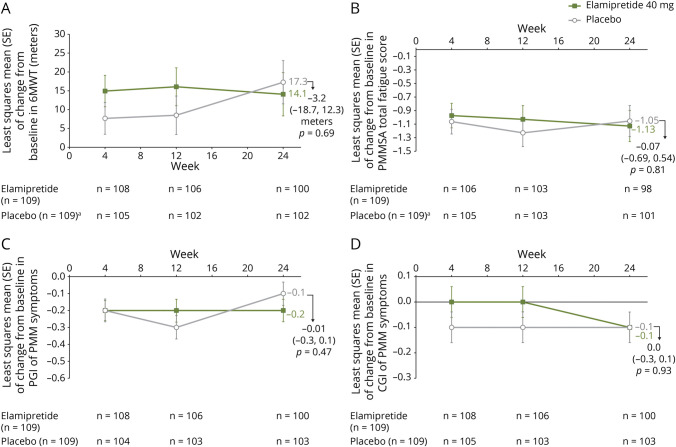
Figure 2. MMPOWER3 Change in Endpoints From Baseline to End of Treatment (Week 24).
In 6-minute walk test (6MWT) (A), in Primary Mitochondrial Myopathy Symptom Assessment Total Fatigue Score (PMMSA) (B), in patient global impression (PGI) of Primary Mitochondrial Myopathy Symptoms (C), and in clinician global impression (CGI) of Primary Mitochondrial Myopathy Symptoms (D). aNo baseline measurements for 2 participants in the placebo group.

