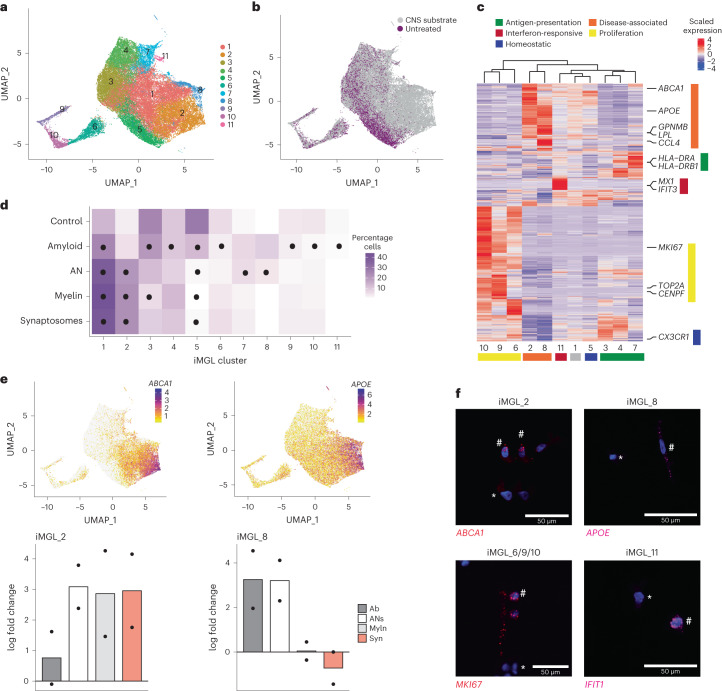
Fig. 1. Treatment of iMGLs with CNS substrates induces diverse transcriptional states that map to those found in vivo.
a, Uniform manifold approximation and projection (UMAP) of iMGLs that were either untreated or treated for 24 h with synaptosomes, myelin debris, synthetic Aβ fibrils or ANs (collectively referred to as CNS substrates) followed by scRNA-seq; total of 56,454 cells across two replicates, cells colored by cluster. b, UMAP projection as in a; cells colored as untreated or CNS-substrate-treated condition. c, Heatmap of differentially enriched genes for each cluster (iMGL_1-11) sorted by similarity and microglial states; states are labeled. d, Mean relative abundance of each cluster across each condition. Circles represent significant differences (adjusted P < 0.05; Supplementary Table 3) determined by a Dirichlet regression test for differential abundance. e, Marker gene expression (top) and log fold change of cluster relative to untreated (bottom) for clusters iMGL_2 (left) and iMGL_8 (right) (n = 2). Syn, synaptosomes; Myln, myelin debris; Ab, synthetic Aβ fibrils. f, Representative images of gene expression with fluorescent in situ hybridization for disease-associated (iMGL_2 and iMGL_8), proliferation (iMGL_6/9/10) and interferon-responsive (iMGL_11) states. All cells were positive for expression of C1QA; not shown for clarity. The hash symbol indicates a positive cell and the asterisk indicates a negative cell. Scale bar, 50 μm. See Extended Data Fig. 4 for quantifications per condition.

