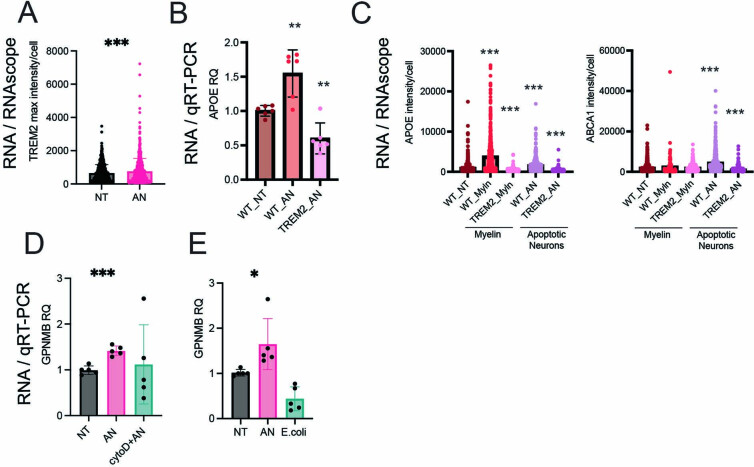
Extended Data Fig. 7. Dependence of iMGL DAM formation on TREM2 expression and substrate.
a) Quantification of relative intensity of TREM2 antibody stain determined by immunocytochemistry (p-value < 0.0001). b) rtPCR of APOE expression in WT and TREM2 KO iMGL(APOE WT_NT vs WT_AN p-value < 0.0035, APOE WT_AN vs TREM2_AN p-value < 0.0002). ABCA1 WT_NT vs WT_MYLN p-value = 0.074, c) APOE, ABCA1 expression level measured by RNAscope. (APOE WT_NT vs WT_MYLN p-value < 0.0001, APOE WT_MYLN vs TREM2_MYLN p-value < 0.0001, APOE WT_NT vs WT_AN p-value < 0.0001, APOE WT_AN vs TREM2_AN p-value < 0.0001, ABCA1 WT_NT vs WT_MYLN p-value = 0.0740, ABCA1 WT_MYLN vs TREM2_MYLN p-value = 0.0754, ABCA1 WT_NT vs WT_AN p-value < 0.0001, ABCA1 WT_AN vs TREM2_AN p-value < 0.0001). For b-c: At least 500 cells were counted by conditions across 4 biological replicates d) rtPCR of GPNMB mRNA in iMGLs untreated or exposed to AN or AN+ cytochalasin D (p-value < 0.0001) e) rtPCR of GPNMB mRNA in iMGLs untreated, treated with AN or E. coli (p-value = 0.0374).

