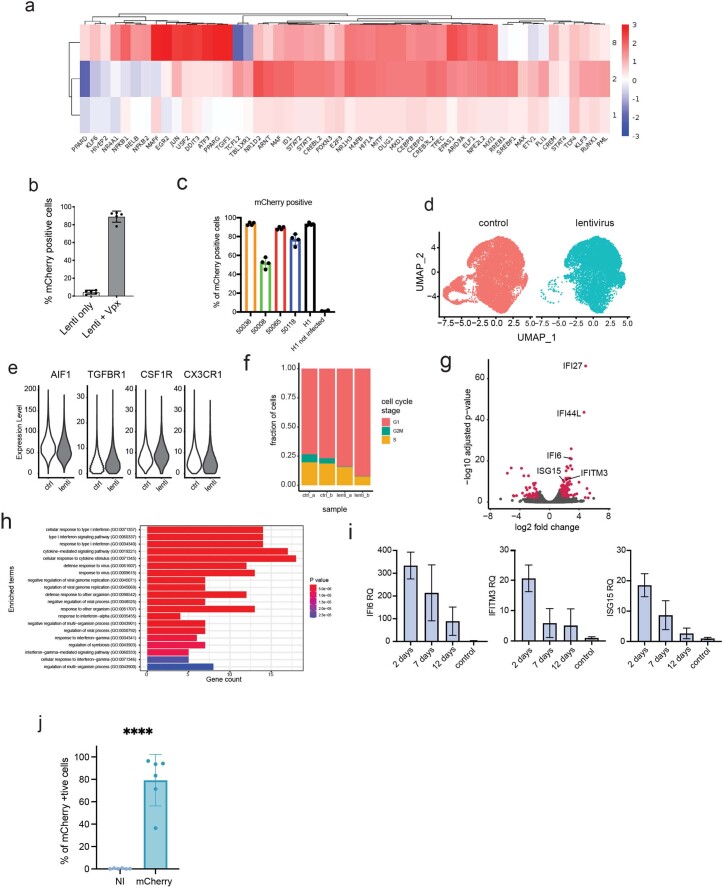
Extended Data Fig. 8. Lentivirus-mediated genetic modification of iMGLs.
a) Heatmap of TFs identified by SCENIC DAM iMGL clusters (iMGL_1, iMGL_2 and iMGL_8), plotted by a scaled and centered area under the curve (AUC) for each regulon b) % of mCherry positive cells in iMGLs transduced with lentivirus only and lentivirus with VPX virus-like particles, determined by flow cytometry (p-value = 0.0079, two-tailed Mann-Whitney test). c) Transduction efficiency of iMGLs transduced from multiple cell lines using co-transduction strategy with VPX. Vector is non-targeting Cas9 control co-expressing mCherry and positive cells determined by flow cytometry d) UMAP projection of single-cell sequencing data from two untreated and lentivirus transduced iMGL differentiations, cells colored by treatment. e) Expression of AIF1, TGFBR1, CSF1R and CX3CR1 in the control and lentivirus samples. (AIF1 p-value = 0.463, TGFBR1 p-value = 0.999, CSF1R p-value = 0.999 and CX3CR1 p-value = 0.2193, Wald test with multiple hypothesis correction was performed with DESeq2). f) Distribution of cells by cell cycle stage in the control and lentivirus transduced samples. g) Volcano plot of differentially expressed genes between control and lentivirus transduced samples. Genes highlighted in red have adjusted p-value < 0.01 and log2 fold change < 1.5. Cycling cells were excluded prior to analysis. h) Gene ontology analysis of differentially expressed genes between control and lentivirus transduced samples. i) rtPCR time-course analysis of expression of three interferon-induced genes in iMGLs after lentivirus transduction. j) Percentage of mCherry-positive cells determined by flow cytometry, the number of cells transduced successfully (**** = p-value < 0.0001) (NI = non-infected). Error bars represent standard deviation.

