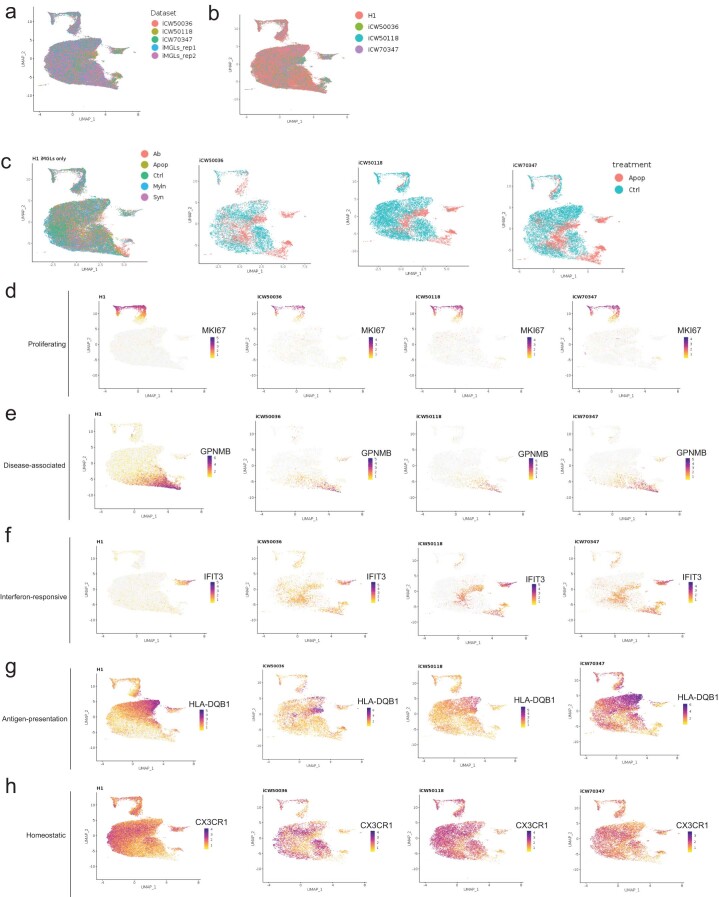
Extended Data Fig. 9. Comparison of H1 and iPSC-derived iMGLs revealed similar transcriptional signatures.
a) UMAP projection of LIGER dataset integration of iMGL dataset and iPSC-derived iMGLs. Cells colored by dataset. b) UMAP projection (as in a), cells colored by line. c) UMAP projection (as in a), cells separated by line identity and colored by treatment condition. d-h) UMAP projection (as in a), cells separated by line identity and colored by expression of MKI67 (d), GPNMB (e), IFIT3 (f), HLA-DQB1 (g) or CXCR3 (h).

