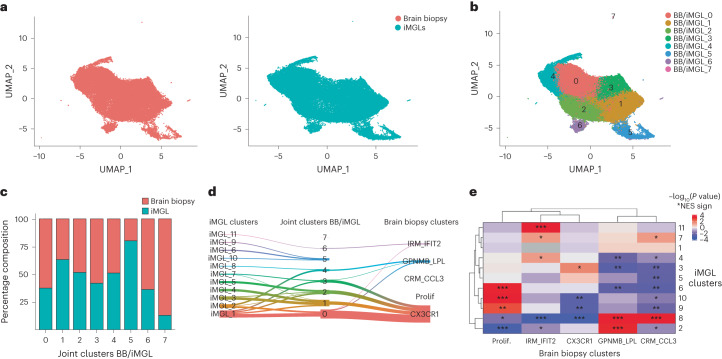
Fig. 2. Dataset integration of iMGL and human cortical biopsy microglia reveals analogous transcriptional states.
a, UMAP projection of integrated human brain biopsy microglia (left) and iMGL profiles (right). Cells are colored by dataset. b, UMAP projection of integrated human brain biopsy microglia and iMGL profiles. Cells are colored by BB/iMGL joint cluster. c, Proportion of cells per joint cluster from each source of data (human brain biopsy microglia or iMGLs), normalized by the proportion of total cells per dataset. d, River plot showing the relationship between joint clusters and the clusters defined in both the iMGL and brain biopsy datasets. Links with fewer than 200 cells have been removed for clarity. e, Heatmap illustrating the relative enrichment significance (as determined by fgsea; Methods) of positively enriched marker genes from each human brain biopsy cluster, within all differentially expressed genes for each iMGL cluster. Prolif, proliferative; NES, normalized enrichment score. *P < 0.05, **P < 0.01, ***P < 0.001.

