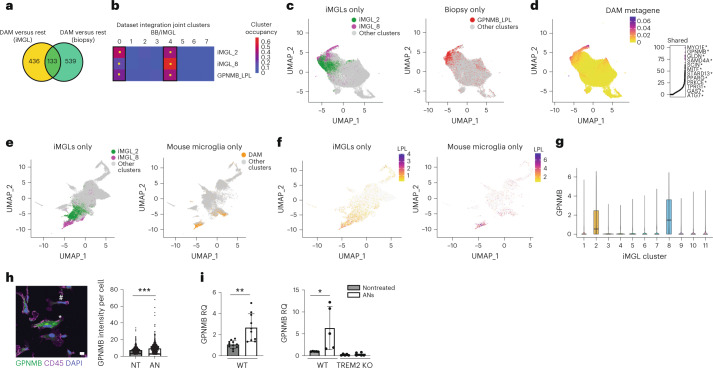
Fig. 3. DAMs generated in vitro are similar to those found in human and in mouse in vivo models.
a, Venn diagram showing overlap between DAM signature iMGL and brain biopsy (P = 3.06 × 10−68, hypergeometric test). b, Percentage distribution of cells from iMGL_2, iMGL_8 and BB_GPNMB_LPL over joint clusters BB/iMGL. Yellow square indicates significant enrichment using binomial test, P < 0.05. c, UMAP projection (as in Fig. 2) colored by cluster identity. d, UMAP projection (as in c) showing the metagene common to both iMGL and brain biopsy DAMs (left) and top genes (right). Asterisk labels genes in the ‘AD1’ DAM cells identified in ref. 24. e, UMAP projection of LIGER integration of iMGL and microglia from the 5xFAD mouse model, cells colored by cluster: iMGL_2 (green), iMGL_8 (magenta) or mouse microglia with DAMs (orange). f, UMAP projection (as in e) showing expression of LPL in iMGLs (left) and mouse microglia (right). g, Violin plot of GPNMB mRNA expression plotted by iMGL cluster; n = 2 replicates per condition, all five conditions pooled. Boxes show the first and third quartiles of the data with a line marking the median. Whiskers mark values closest to 1.5 times the interquartile range; no outliers are plotted. h, Immunocytochemistry of GPNMB expression in iMGLs treated with ANs or PBS. Left, representative image showing GPNMB (green) and CD45 (magenta, microglia marker). Asterisk indicates a positive cell, and hash indicates a negative cell. Right, quantitative analysis (two-tailed t-test, ***P < 0.001; at least 500 cells were counted per condition, data combined from four replicates, mean and s.d. are shown). Scale bar, 50 μm. i, Quantitative rtPCR of GPNMB expression in H1 iMGLs (left) and TREM2-deficient or isogenic iMGLs (right) treated with ANs or PBS. For H1 iMGL, two-tailed t-test, P = 0.0009, n > 4, mean and s.d. of relative quantification (RQ) are shown; for TREM2-deficient or isogenic iMGL, two-tailed t-test, P = 0.0427, n > 4, mean and s.d. are shown. KO, knockout; WT, wild type. *P < 0.05, **P < 0.01.

