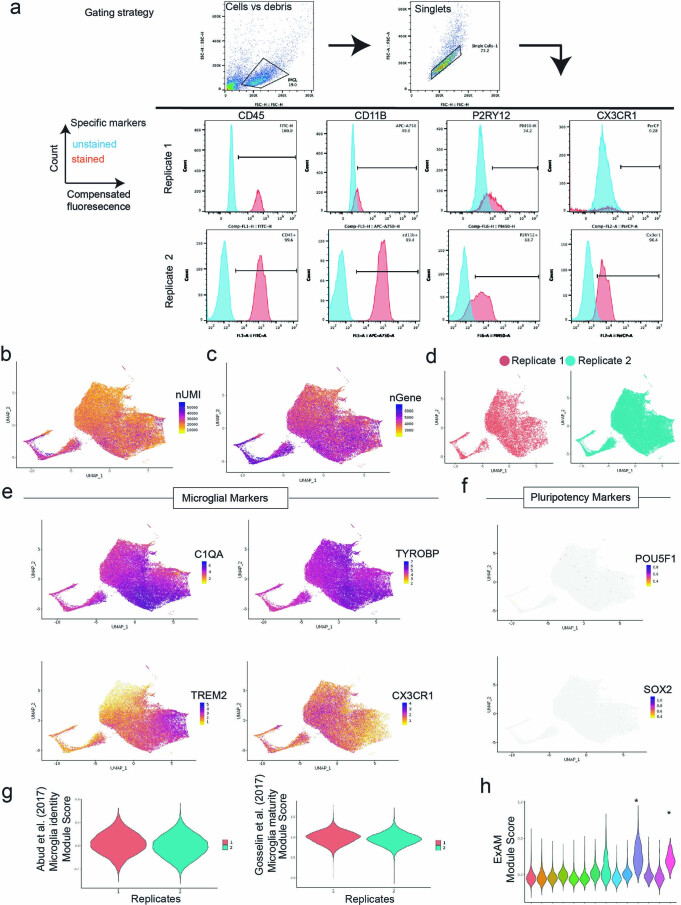
Extended Data Fig. 1. Single-cell RNAseq of iMGLs and quality control.
a) Flow cytometry gating strategy and plots illustrating expression of microglial protein markers from the two independent differentiations used for the scRNAseq dataset. Cells underwent either flow cytometry or single-cell RNAseq. b-c) UMAP projection (as in Fig. 1a) of quality control metrics for iMGL dataset highlighting the number of unique molecular identifiers (nUMI, b) and the number of genes (nGene, c). d) UMAP projection (as in Fig. 1a), cells colored by replicate. e) UMAP projection (as in Fig. 1a) showing expression of four key microglial markers. f) UMAP projection (as in Fig. 1a) showing expression of two stem cell markers. g) Module scores for microglia identity and maturity per cell, plotted by replicate h) Module scores for microgliaExAM signature22 per cells plotted per iMGL cluster. Two high ExAM clusters were removed(*). Note n = 2 independent differentiations for B-F.

