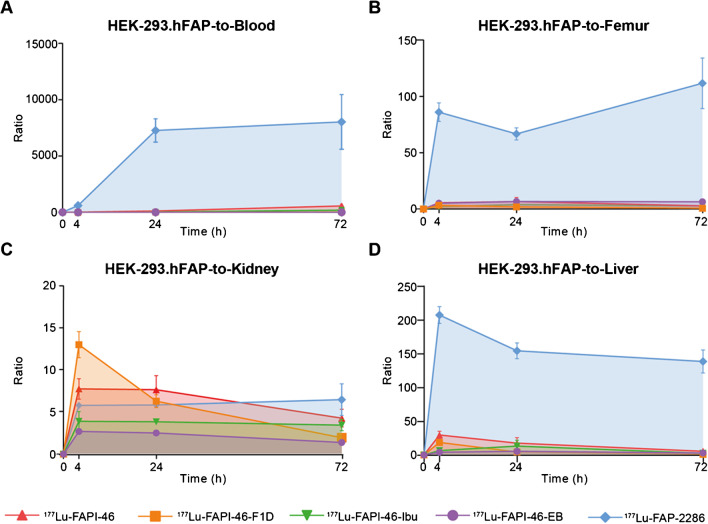
Fig. 5.
Area under the curve (AUC) of A tumor-to-blood, B tumor-to-femur, C tumor-to-kidney, and D tumor-to-liver ratio of the radioligands in the high FAP-expressing HEK-293.hFAP xenografts, expressed as mean ± standard deviation. [177Lu]Lu-FAP-2286 presented the most favorable tumor-to-blood, tumor-to-femur, and tumor-to-liver ratios over time. Tumor-to-kidney AUC values were in a comparable range for all radioligands, with the exception of the [177Lu]Lu-FAPI-46-EB that showed a significantly lower AUC

