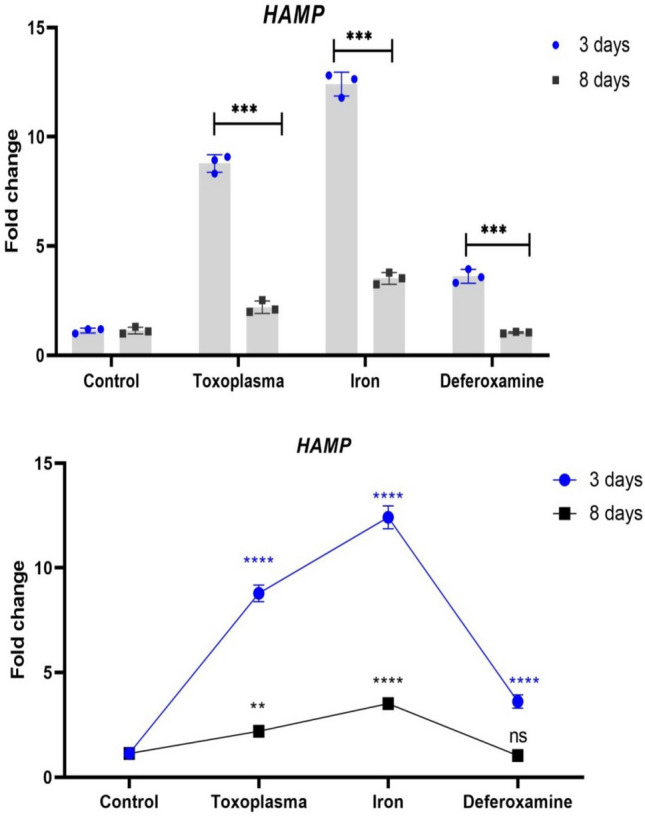
Fig. 3.

Differences in expression of HAMP between 3 and 8 days in each group. Each dot/ squar refers to the mean of 3replicates and error bar indicate the standard error. The stars refer to the significant differences in HAMP expression between each group and the controls at the respective time point as estimated by two-way ANOVA with Tukey’s post-hock test
