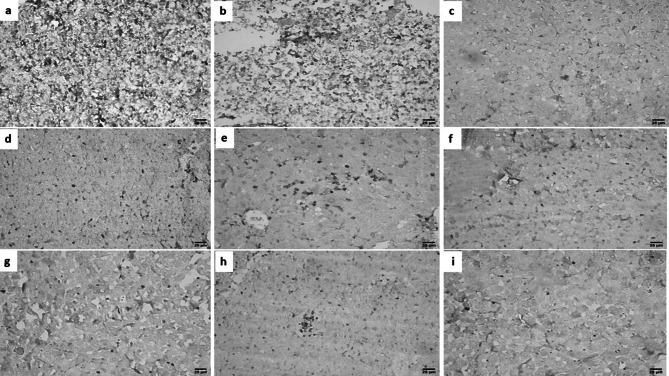
Fig. 8.
IHC results for liver sections of different study groups (IHC-peroxidase-DAB, X400). a, b GII showing high expression of CD8+. c GIII showing low expression of CD8+. d GIV showing intermediate expression of CD8+. e GV showing intermediate expression of CD8+. f GVI showing low expression of CD8+. g GVII showing low expression of CD8+. h GVIII showing low expression of CD8+. i GIX showing low expression of CD8.+. [GI (normal control), GII (infected control), GIII (infected, NPs treated), GIV (infected, BV treated), GV (infected, BVL-MOFs-NPs), GVI (infected, spiramycin treated), GVII (infected, SL-MOFs-NPs), GVIII (infected, ciprofloxacin treated), GIX (infected, CL-MOFs-NPs)]

