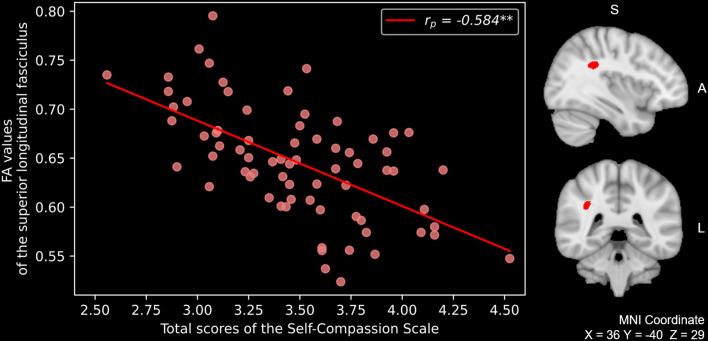
Figure 1.
The total scores of SCS were negatively correlated with FA values of the right superior longitudinal fasciculus in healthy individuals [p < 0.05 (FWE-corrected)]. Images of the sagittal and coronal view were superimposed on the MNI 1 mm template. For better visibility, the result was thickened using the “tbss-fill” command. SCS self-compassion scale, FA fractional anisotropy, FEW Family-Wise Error, S superior, A anterior, L left, MNI Montreal Neurologic Institute.

