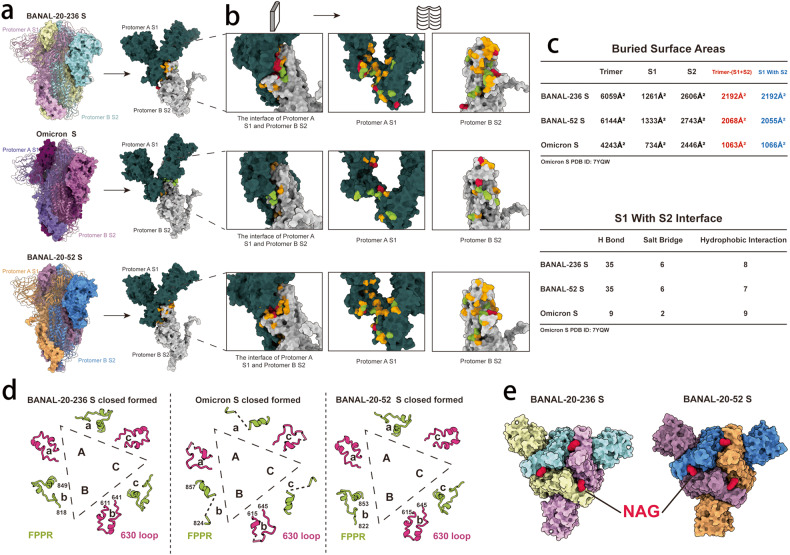
Fig. 5. Structural analysis of BANAL-20-236, BANAL-20-52, and SARS-CoV-2 S trimmers.
a Left: trimeric structures of BANAL-20-236, BANAL-20-52, and omicron BA.2.75S proteins, S1 of protomer A and S2 of protomer B were shown as ribbon, the rest of trimer was shown as surface presentation. Top, BANAL-20-236; middle, omicron BA.2.75; bottom, BANAL-20-52. Right: surface presentation of the S1 of protomer A (dark green) and the S2 of protomer B (gray). Omicron S PDB ID: 7YQW. b Magnified open flat book view of interface interaction of S1 of protomer A and S2 of protomer B. The first column: the side view of S1-S2 interface; the second and third columns: Open flat book view of interface interactions of S1 and S2 in the first column. Bright yellow, amino acid residues forming hydrogen bonds; red, amino acid residues involved in salt bridges; green, amino acid residues involved in hydrophobic interactions. c Top: the buried surface areas of all “closed” trimeric S proteins of BANAL-20-236, BANAL-20-52 and Omicron BA.2.75 at pH 5.5. Trimer: all buried surface areas; S1: areas of the interaction interface between S1 subunits only; S2: areas of the interaction interface between S2 subunits only; Trimer-(S1 + S2): Trimer column-S1 column-S2 column; S1 with S2: areas of interaction interface between S1 and S2. Bottom: the number of the residues involved in hydrogen bonding, salt bridge, and hydrophobic interaction at the interface of S1 and S2 interaction. Omicron BA.2.75S PDB ID: 7YQW. d Structural comparison of the 630 loop (rose) (BANAL-20-236: residues 611–641, BANAL-20-52: residues 615–645, Omicron: residues 615–645) and FPPR (green) (fusion peptide proximal region) (BANAL-20-236: residues 818–849, BANAL-20-52: residues 822–853, Omicron: residues 824–857). Dashed lines indicate the missing gaps. Omicron S PDB ID: 7YQW. e Top views of the trimeric S proteins of BANAL-20-236 and BANAL-20-52. The NAG moiety at N370 of S proteins was shown in red.

