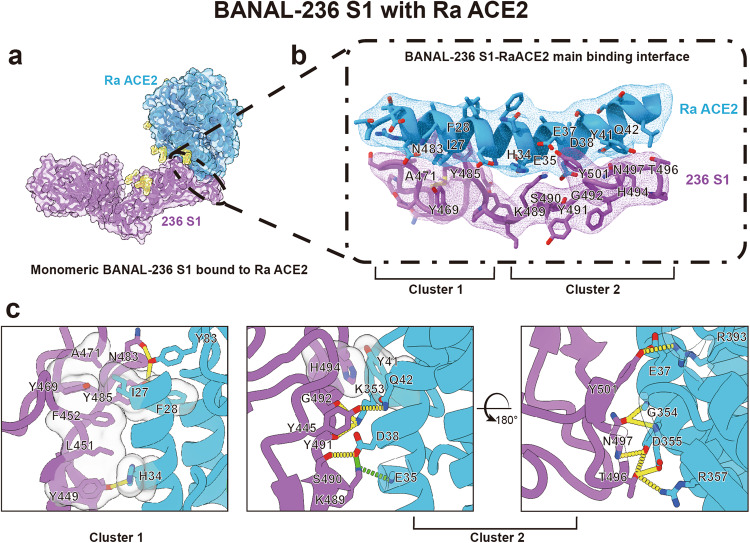
Fig. 6. Cryo-EM structure of BANAL-20-236 S1 in complex with R. affinis ACE2.
a Overall structure of BANAL-20-236 S1 in complex with R. affinis ACE2 (PDB ID: 8HXK). Purple: the BANAL-20-236 S1 in ribbon form; blue: R. affinis ACE2 in ribbon form. The surface presentation was semi-transparent. b Ribbon representation of the interaction interface of the BANAL-20-236 S1/Ra ACE2 complex. Purple: the BANAL-20-236 S1; blue: R. affinis ACE2. The EM map densities of BANAL-20-236 S1 and R. affinis ACE2 in B are shown in purple and blue meshes. There are two clusters of interaction at the interface, Clusters 1 and 2. c Detailed interaction between BANAL-20-236 S1 and R. affinis ACE2. Purple: the BANAL-20-236 S1; blue: R. affinis ACE2. Hydrogen bonds and salt bridges are presented as yellow dashed lines and green dashed lines, respectively, and hydrophobic interactions are shown as semi-transparent gray bubble-shape.

