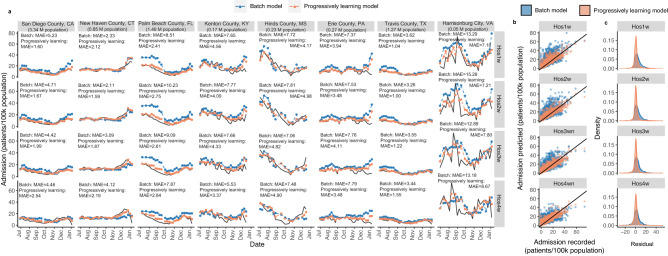
Fig. 5. Comparison between actual admission records and the prediction results from batch models and progressive learning models for data in June 2022- January 2023.
a The prediction results from the batch model (in blue) and progressive learning model (in orange) and the actual admission records (in black) for weekly new admissions in eight representative counties. Hos1w, Hos2w, Hos3w, Hos4w are the upcoming week, the second, third and fourth week after the wastewater sampling, respectively. b The prediction results from the batch model (in blue) and progressive learning model (in orange) verse the actual admission records for weekly new admissions. c The error distribution between prediction results and actual admission records for the batch model (in blue) and progressive learning model (in orange) for predicting weekly new admissions.

