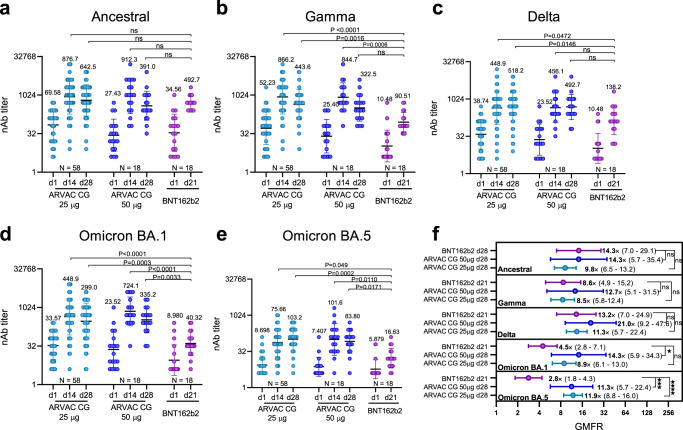
Fig. 5. Comparison of nAb GMT and GMFR after booster with ARVAC CG or booster with BNT162b2.
Neutralizing antibody titers against the Ancestral (a), Gamma (b), Delta (c), Omicron BA.1 (d) and Omicron BA.5 (e) variants of SARS-CoV-2 in plasma samples of individuals boosted with the indicated vaccine (ARVAC CG 25 µg, ARVAC CG 50 µg or BNT162b2) prior booster administration (d1) or at the indicated days after booster administration (d14, d21, d28). Each point represents the nAb titer of a volunteer. Data are from participants with no missing data at all analyzed time points (ARVAC CG 25 µg (N = 58), ARVAC CG 50 µg (N = 18) or BNT162b2 (N = 18). The nAb GMTs and 95% CIs are shown as horizontal and error bars, respectively. The numbers depicted above the individual points for each specified time point and viral variant represent the GMTs. The number of participants included in each data set analyzed is depicted in the bottom of the graph (N = number of individuals in each data set). Statistical differences were analyzed using the Kruskal-Wallis test followed by the Dunn´s multiple comparison test. P-values are depicted above the data sets that were compared. ns: P > 0.05. Exact P-values for each comparison are: BNT162b2 d21 vs. ARVAC CG 25 µg d14: P = 0.000007 (b), P = 0.0472 (c), P = 0.00001 (d) and P = 0.049 (e); BNT162b2 d21 vs. ARVAC CG 25 µg d28: P = 0.0016 (b), P = 0.015 (c), P = 0.0003 (d) and P = 0.0002 (e); BNT162b2 d21 vs. ARVAC CG 50 µg d14: P = 0.0006 (b), P = 0.00003 (d) and P = 0.0110 (e); BNT162b2 d21 vs. ARVAC CG 50 µg d28: P = 0.0033 (d) and P = 0.0171 (e). f Fold increases in the GMT from day 1 to day 21 or 28 (GMFR) for each specified variant represented by a point and written with a number followed by a ×. The horizontal lines represent the 95% CIs. Data are from participants with no missing data at baseline and at all time points analyzed (ARVAC CG 25 µg (N = 58), ARVAC CG 50 µg (N = 18) or BNT162b2 (N = 18). Statistical differences were analyzed using Kruskal-Wallis test followed by the Dunn´s multiple comparison test. ns: P > 0.05, ★P = 0.0243; ★★★P = 0.0009; ★★★★P = 0.00004.

