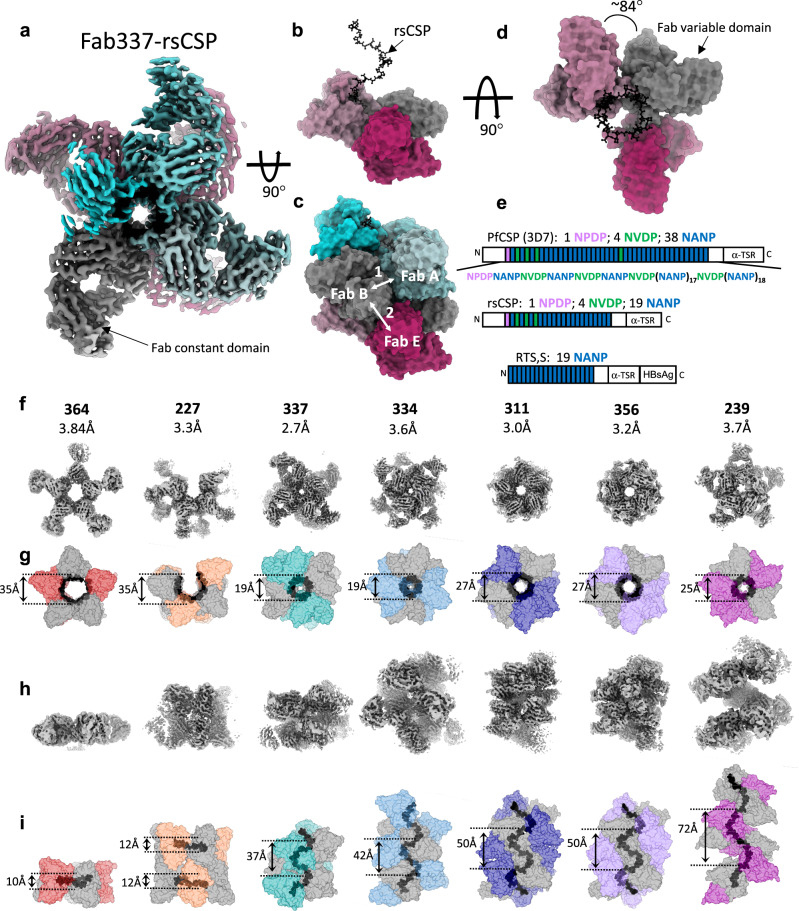
Fig. 1. High resolution cryo-EM of IGHV3–33 Fabs in complex with rsCSP.
a Cryo-EM map of 337-rsCSP at 2.7. Å, viewing down the axis of the rsCSP helix. b Side-view of the 337-rsCSP structure, with four of seven Fabs removed to highlight rsCSP helical structure in black. In all structures, the Fab constant domain is disordered, thus only the Fab variable region is modeled. c Same as in (b), with all seven Fabs shown. Two homotypic interfaces (1 and 2) are highlighted. d Top view of b. Rotation angle between Fabs (helical turn) is shown. e Schematic of PfCSP sequences relevant to current study. f Top view, i.e., as viewed down the axis of rsCSP helix, of cryo-EM maps. mAb name and the resolution of each cryo-EM map are listed. In panels f-i, all structures and maps are on the same scale to enable comparison of relative dimensions. g Top view of the molecular surface representation of the various structures. rsCSP is colored in black. Diameter of the rsCSP helix is listed. h Side view of the cryo-EM maps. i Side view of the cryo-EM structures, displayed as a molecular surface. Helical pitch is shown.

