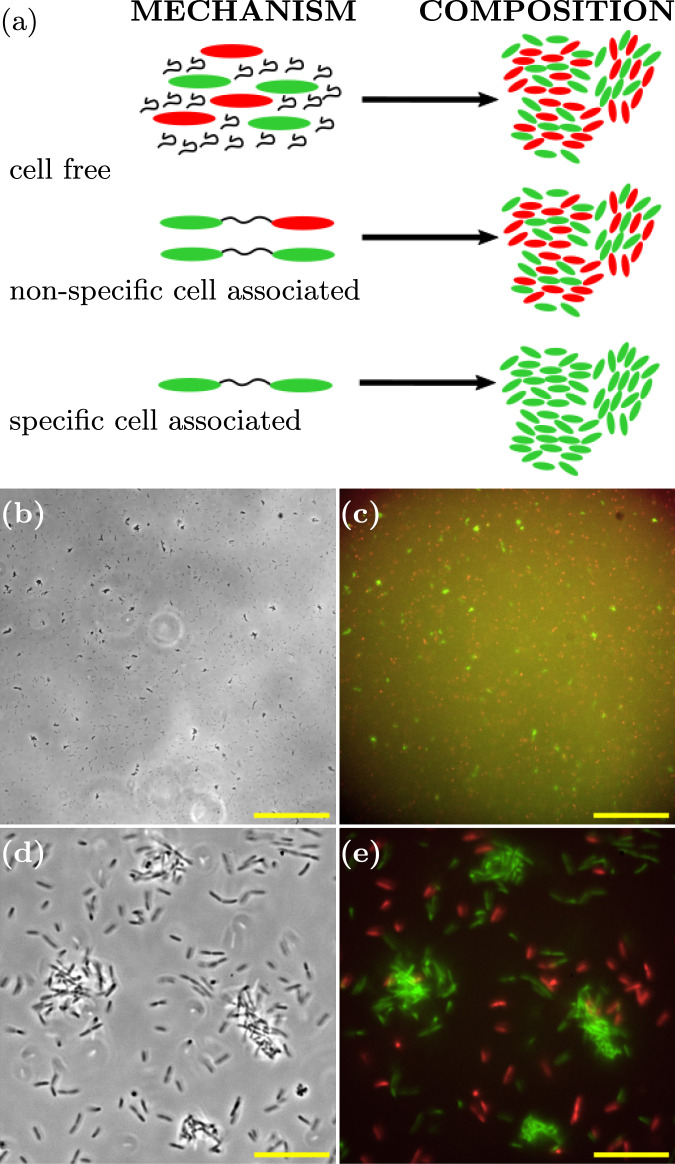
Fig. 8. Cell-associated Psl mediates cell–cell cohesion.
a Schematic outlining the composition of aggregates (right) resulting from the corresponding mechanism of Psl-mediated cohesion (left). b Representative phase-contrast microscopy image (×20 magnification) taken 3.8 h after inoculation, scale bar = 150 μm. c Superposed fluorescence images from green (Psl-producer, Δpel-GFP) and red (non-producer, ΔpelΔpsl-mCherry) channels corresponding to (b), scale bar = 150 μm. d Representative phase-contrast microscopy image (×150 magnification) 4.0 h after inoculation, scale bar = 20 μm. e Superposed fluorescence images from green (Psl-producer, Δpel-GFP) and red (non-producer, ΔpelΔpsl-mCherry) channels corresponding to (d), scale bar = 20 μm.

