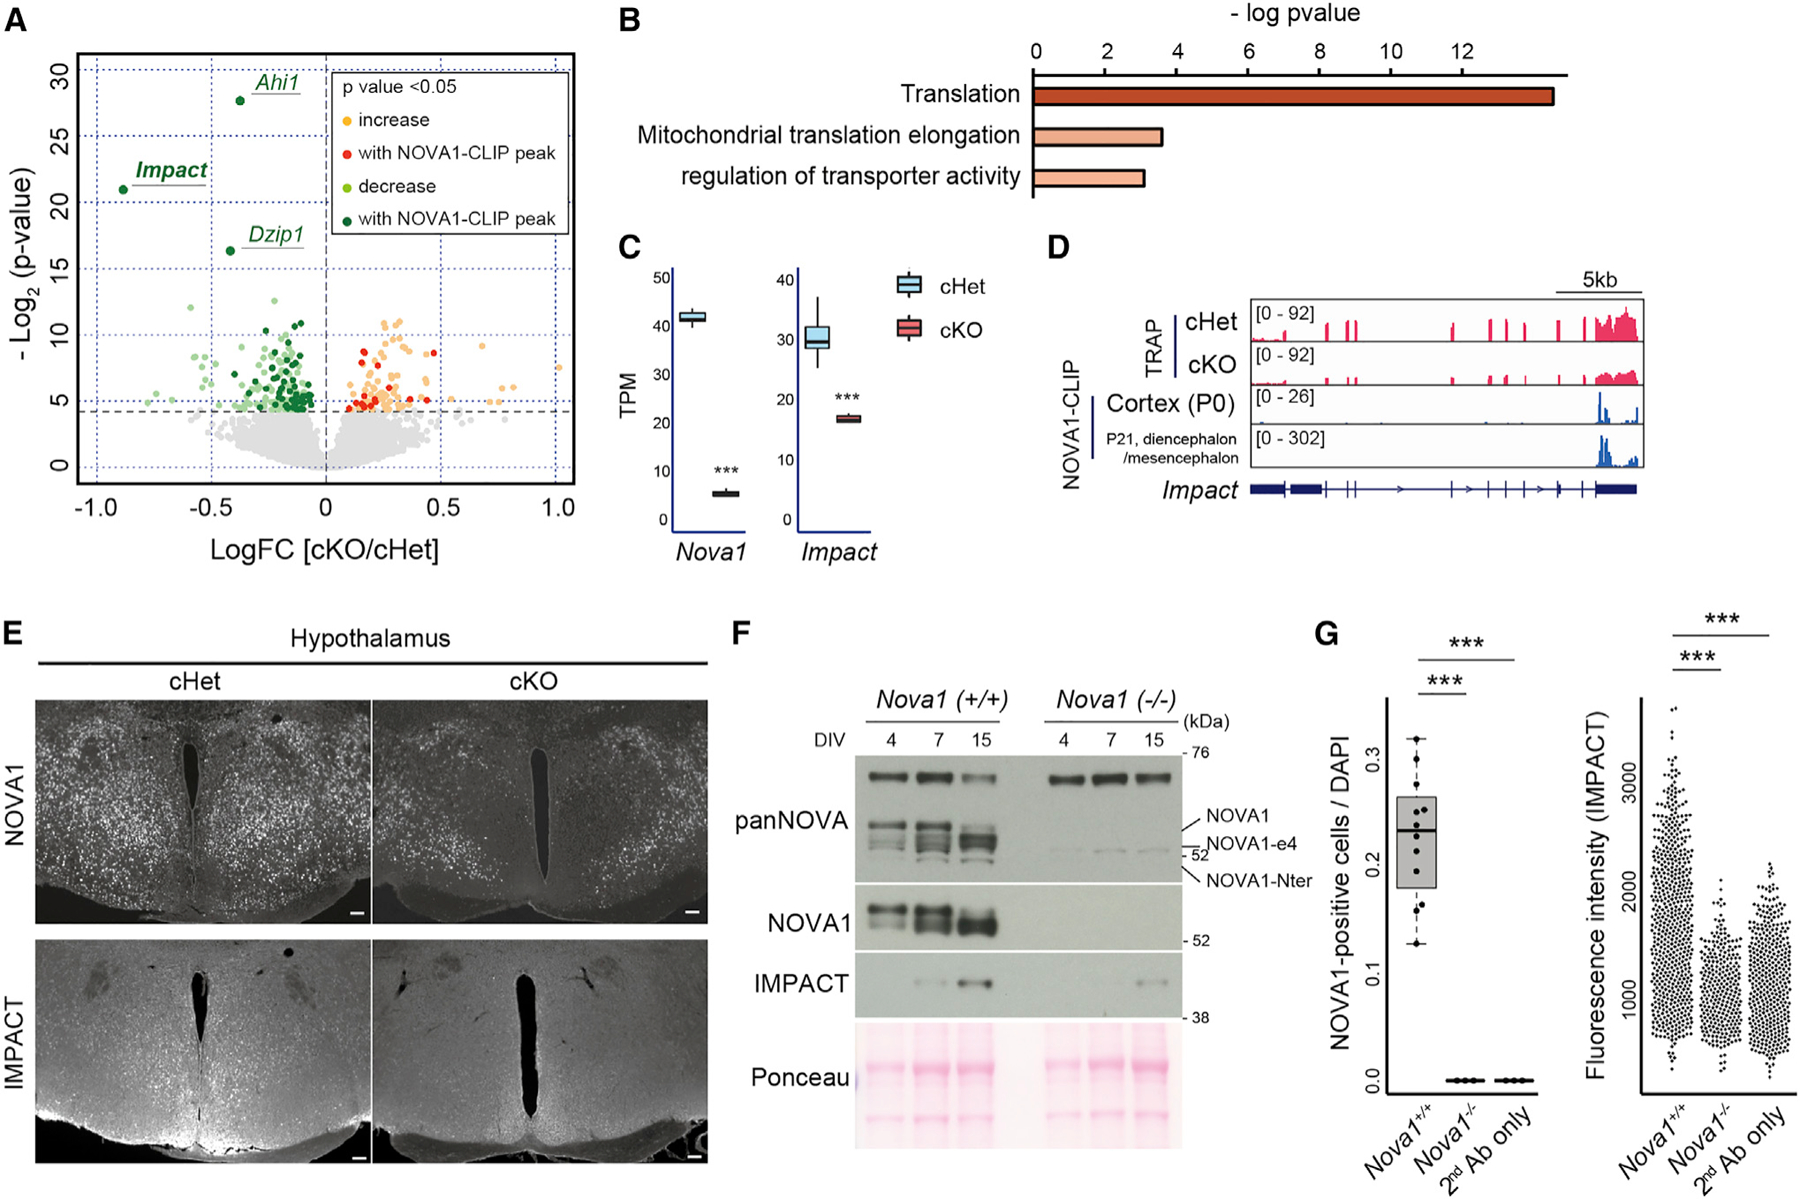
Figure 4. Nova1 is required for Impact expression in inhibitory neurons.

(A) Volcano plots of TRAP data from P0 whole brain for cHet and cKO. Yellow and light green indicate genes thatare significantly up- or down-regulated in cKO, and red and green indicate those with NOVA1 CLIP peaks on the genes, respectively. NOVA1 CLIP data from the cerebral cortex of P0 mice (Saito et al.12) were used.
(B) GO analysis of genes whose expression was upregulated in cKO mice in TRAP-seq.
(C) Box-and-whisker plots of Nova1, Nova2, and Impact RNA-seq reads from TRAP data. TPM, transcripts per million. Median values are indicated as horizonal lines with 25th–75th percentiles and whiskers (minimum and maximum values). The p values were determined by Wilcoxon test (***p < 0.005).
(D) Integrative Genomics Viewer (IGV)50 tracks of the Impact locus. P0 TRAP data and NOVA1 CLIP data (P0 cortex and P21 diencephalon/mesencephalon) are shown.
(E) Immunostaining for NOVA1 and IMPACT in the hypothalamus of 12-week-old mice. Serial sections were used in each genotype. 40× magnification. Scale bar, 100 μm.
(F) Western blot analysis of NOVA1 and IMPACT against lysates from primary neuron culture of control (Nova1+/+) and Nova1 KO (Nova1−/−) mice.
(G) Comparison of the ratio of NOVA1+ cells in culture (left) (median values are indicated as horizonal lines with 25th–75th percentiles and whiskers [minimum and maximum values]) and IMPACT staining intensity (right) in primary neurons obtained from Nova1+/− and Nova1−/− mice on day 15 of culture. The p values were determined by Wilcoxon test (***p < 0.005).
