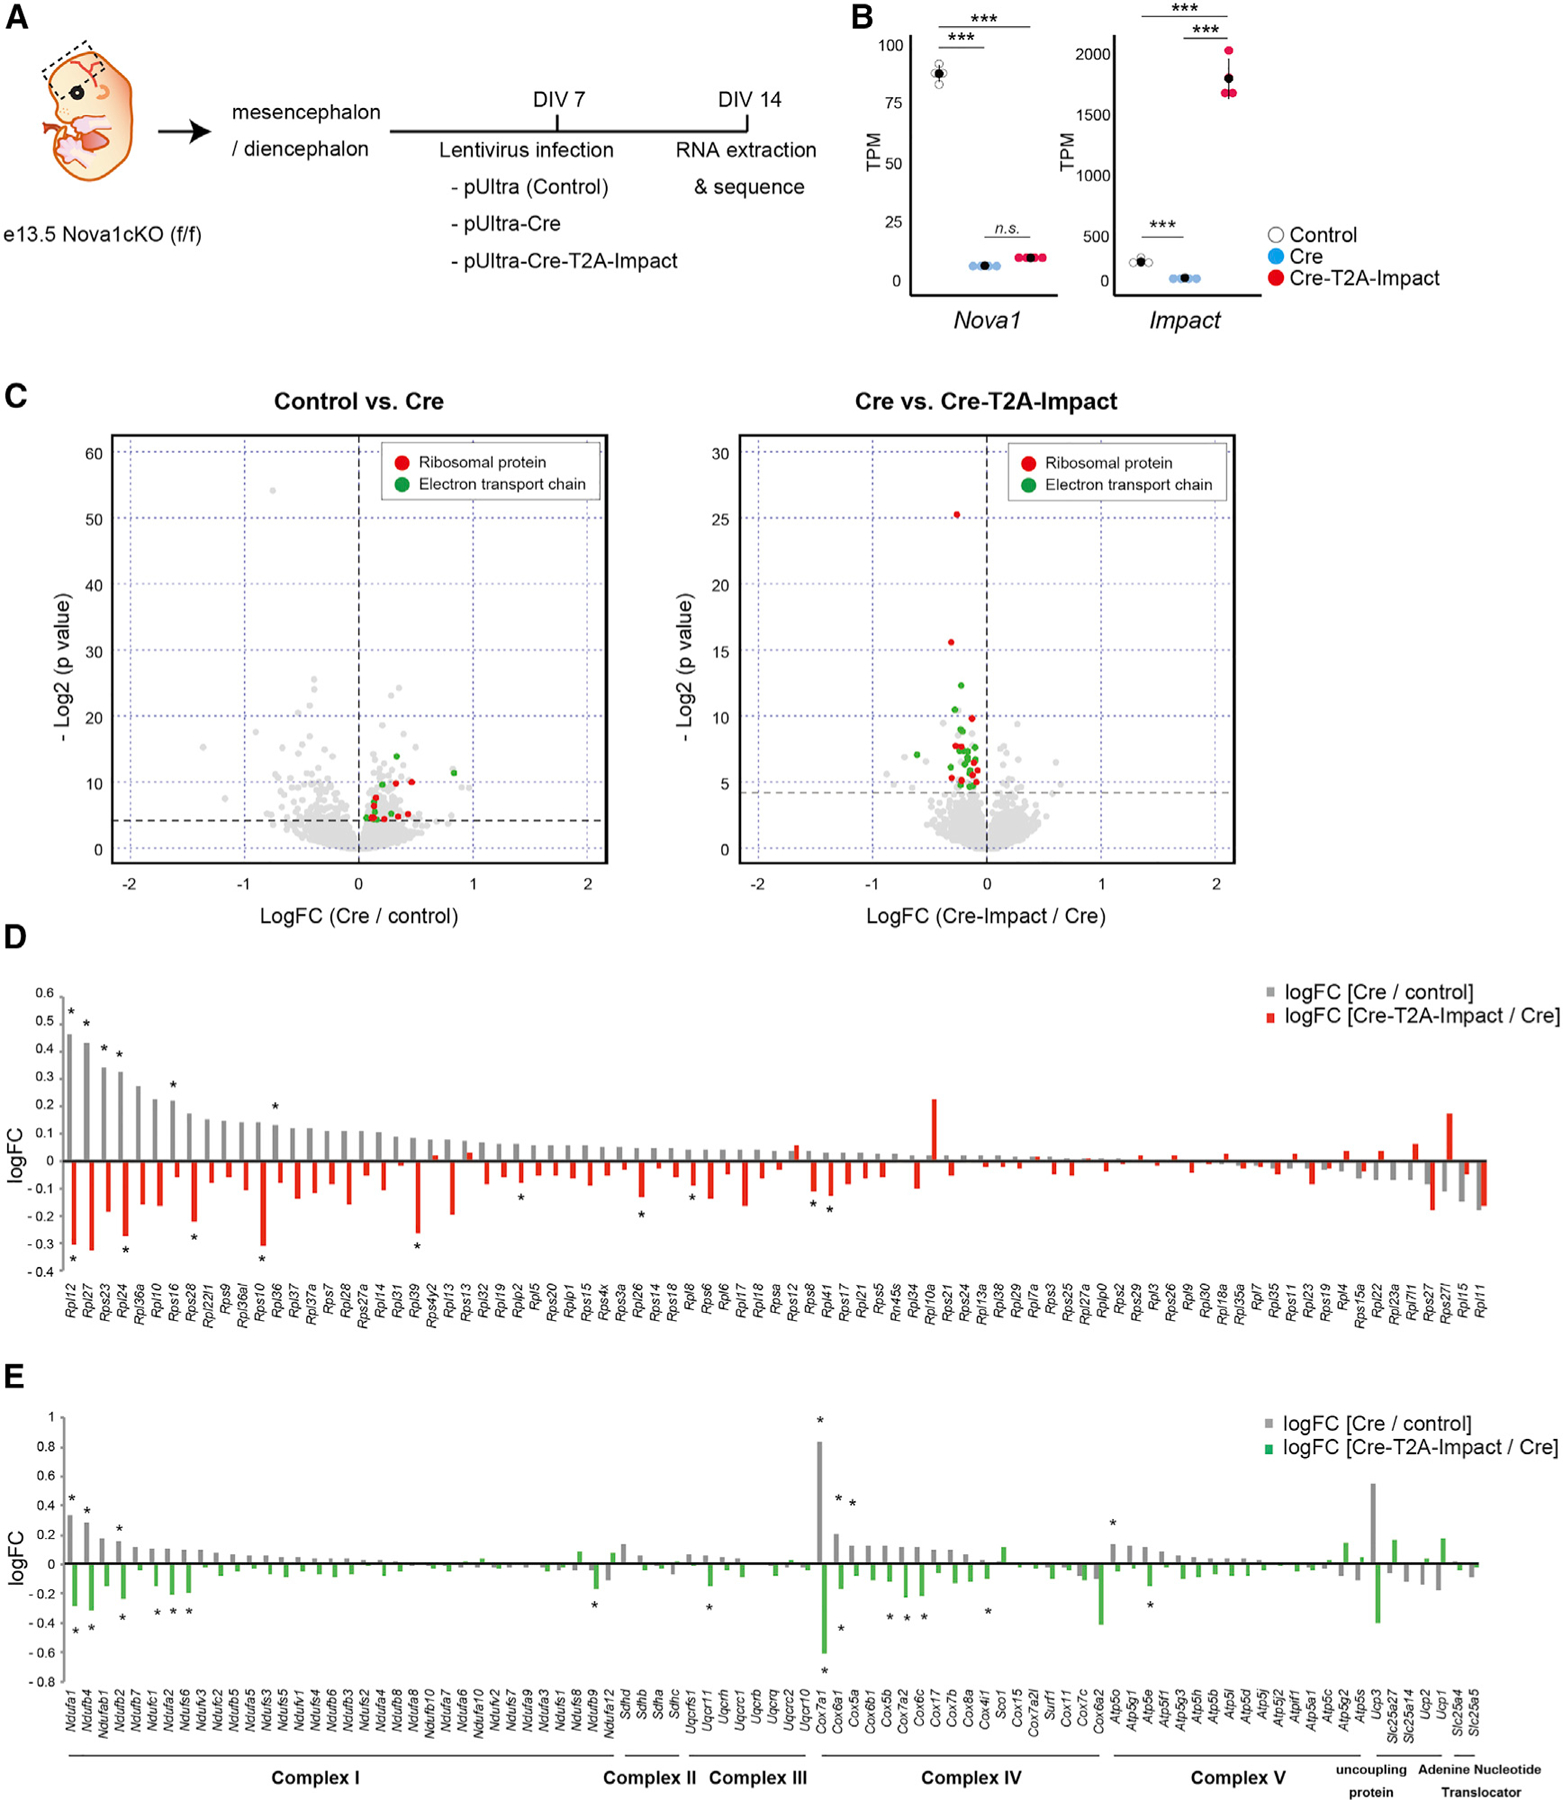
Figure 5. Ectopic Impact expression restores the expression of ribosomal and electron transport genes in Nova1 KO neurons.

(A) Diagram of the experiment.
(B) Comparison of Nova1 and Impact mRNA expression in cells infected with each lentivirus (mean ± SEM, n = 4, Wilcoxon test, ***p < 0.005).
(C) Volcano plots comparing control versus Nova1-null cells (cells infected with a control or Cre-expressing lentivirus, left) and Nova1-null versus Nova1-null + Impact (cells infected with a Cre-expressing lentivirus or Cre-T2A-Impact-expressing lentivirus, right). Genes encoding ribosomal proteins are shown in red, and genes encoding electron transport chains are shown in green.
(D) Bar graph showing changes in expression of ribosomal protein genes. The gray bars show the log fold change (logFC) of Cre-lentivirus-infected cells relative to controls, and the red bars show the logFC of Cre-T2A-Impact lentivirus-infected cells relative to Cre-lentivirus-infected cells. Asterisks indicate significant changes (Wilcoxon test, *p < 0.05).
(E) Bar graph showing changes in expression of genes belonging to the electron transport chain. The gray bars show the logFC of Cre-lentivirus-infected cells relative to controls. The green bars show the logFC of Cre-T2A-Impact lentivirus-infected cells relative to Cre-lentivirus-infected cells. Asterisks indicate significant changes (Wilcoxon test, *p < 0.05).
