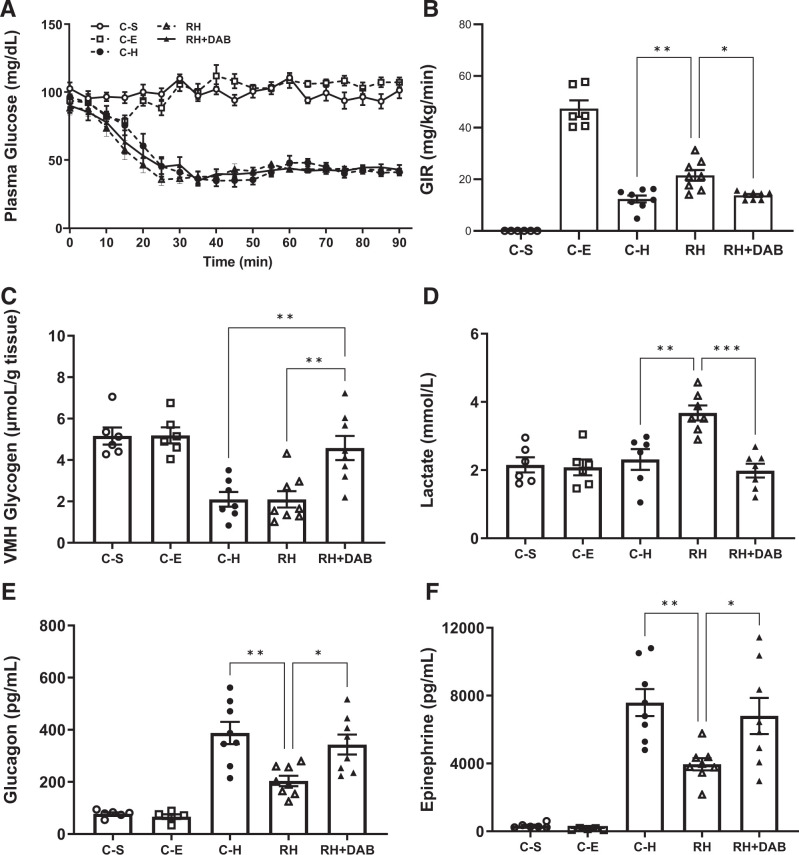
Figure 2.
(A) Plasma glucose concentrations of all treatment groups during the glucose clamp procedure. Plasma glucose concentrations were well matched between animals either receiving a saline infusion or undergoing the hyperinsulinemic-euglycemic clamp. Plasma glucose concentrations were matched for groups undergoing the hypoglycemic clamp as well. (B) Average glucose infusion rates (GIR) during the last 20 min of the clamp procedure for all treatment groups. (C) VMH glycogen levels following the clamping procedure. (D) Basal extracellular lactate concentrations in the VMH. (E) Peak plasma glucagon concentrations during the clamping procedure. (F) Peak plasma epinephrine concentrations during the clamping procedure. C-S: N = 6; C-E: N = 6; C-H: N = 8; RH: N = 8; RH+DAB: N = 8. Data are presented as mean ± SEM. *P < 0.05, **P < 0.01, and ***P < 0.001.

