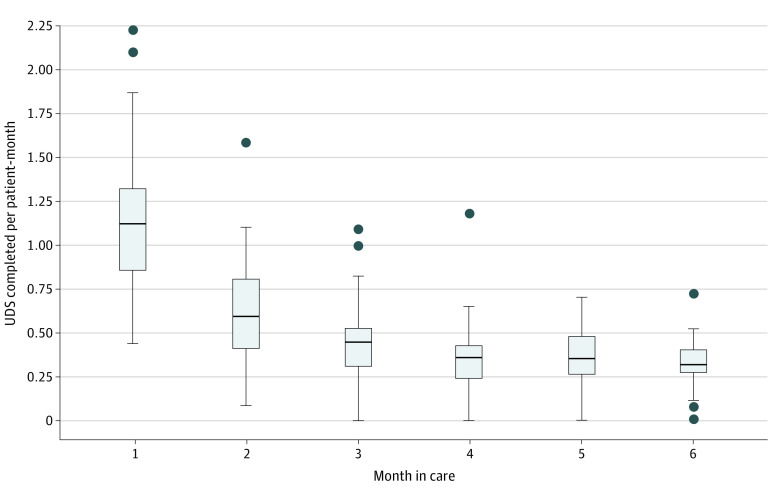
Figure. Clinician Rates of Completed Urine Drug Screenings (UDS) per Patient-Month, by Month in Care.
The horizontal bar inside the boxes indicates the median, and the lower and upper ends of the boxes are the first and third quartiles. Lower whisker extends to the smallest value no further than 1.5 × IQR from the 25th percentile value, and upper whisker extends to the largest value no further than 1.5 × IQR from the 75th percentile value; shaded circles indicate outlier data points.

