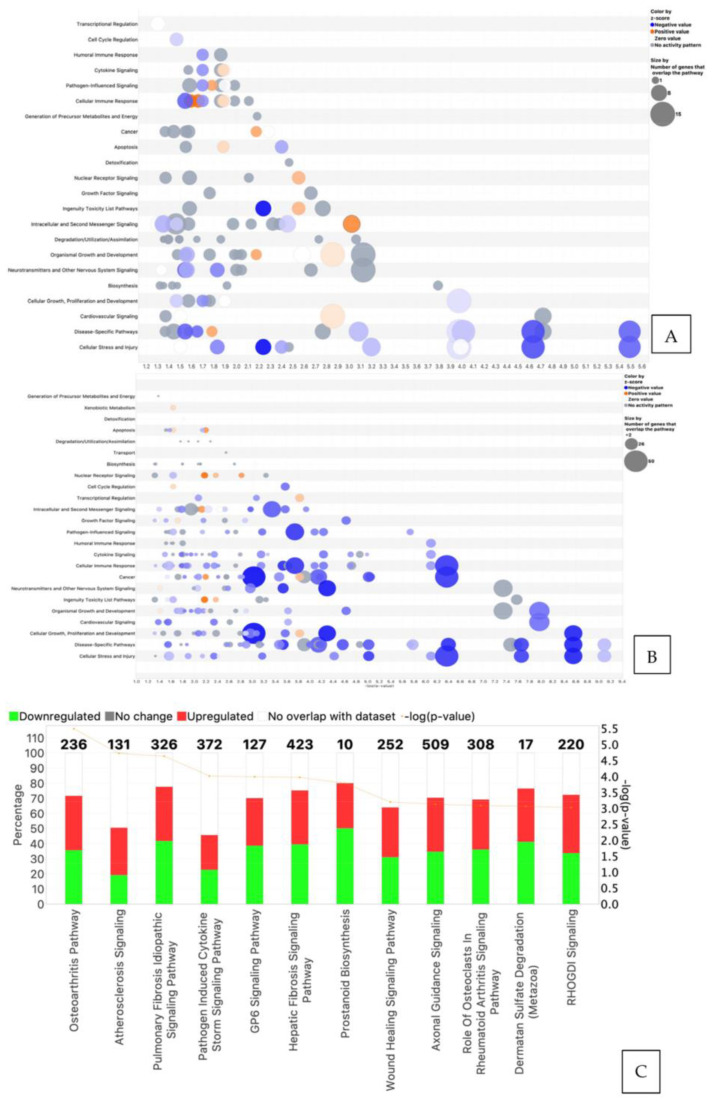
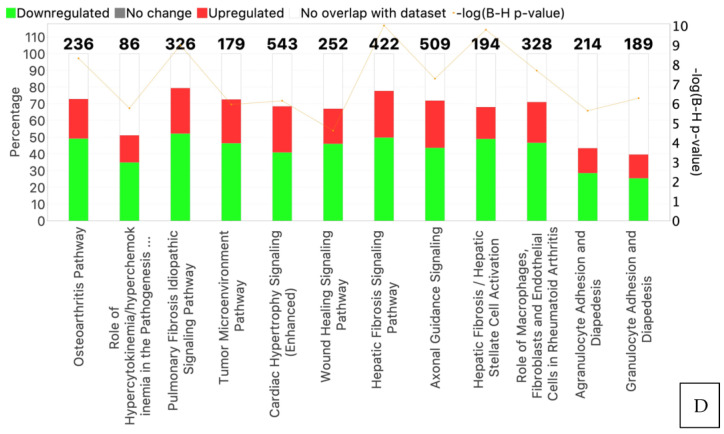
Figure 3.
(A) Bubble plot of the interconnected canonical pathways associated with differential gene expression in RES-treated serum-starved osteoblasts. Canonical pathway names (Y axis) and correlated Z scores (X axis), with red bubbles indicating upregulation of the pathway and blue bubbles representing downregulation of the pathway. The bubble size is indicative of the number of genes that overlap the pathway. (B) Bubble plot of the overlapping canonical pathways associated with differential gene expression in serum-starved osteoblasts treated with POG. The red/orange colors represent upregulated canonical pathways based on Z-scores, while blue colors represent downregulated pathways. The gray shades are pathways with neutral Z-scores. (C,D) The most significantly impacted canonical pathways in hFOB osteoblasts treated with RES (C) or POG (D), p-values, % overlap of DGEs and the number of genes (red = upregulated, green = downregulated, Z score > 2.5). Fisher’s exact test (p ≤ 0.05) was used to assess the canonical pathways correlated with the DGEs.


