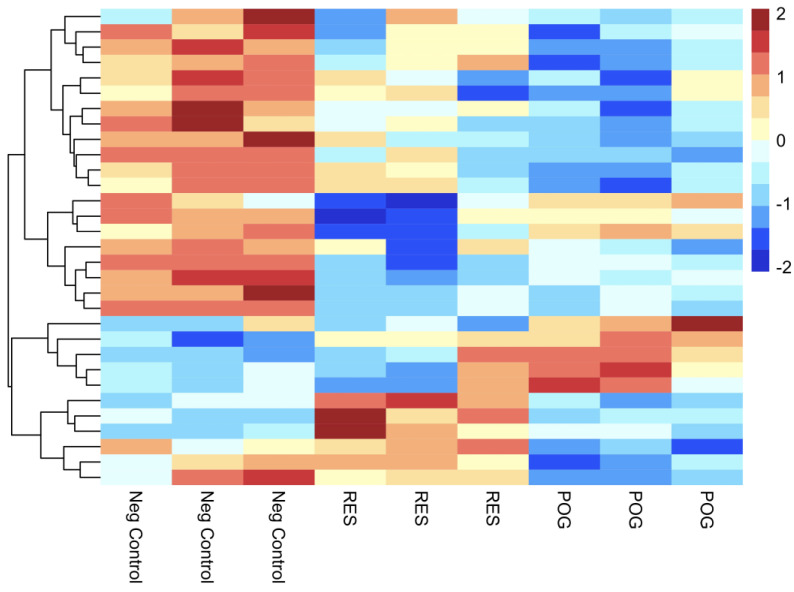
Figure 4.
Heatmap visualization of the 30 most significant up- and downregulated DGEs, including gene ontology. Three replicates for negative control hFOB osteoblasts, three for RES treatment and three for POG-treated osteoblasts. The red/pink colors are upregulated genes, and the blue/dark blue colors represent downregulated genes using a Z-scored Log2 CPM. A gene ontology enrichment analysis is displayed to show functional distribution.

