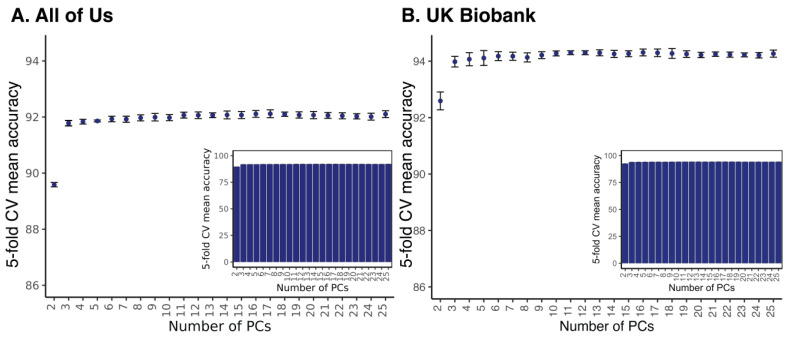
Figure 2.
Accuracy for prediction of biobank participants’ race and ethnicity using pharmacogenomic PCA data. Results are shown for (A) All of Us and (B) UKB. Prediction accuracy values ± standard deviations, based on 5-fold cross-fold (CV) validation, are shown (y-axis) according to the number of PCs used for prediction (x-axis). The y-axis is truncated for clarity in the main plot, and the inset shows the same accuracy and standard deviation values with an untruncated y-axis.

