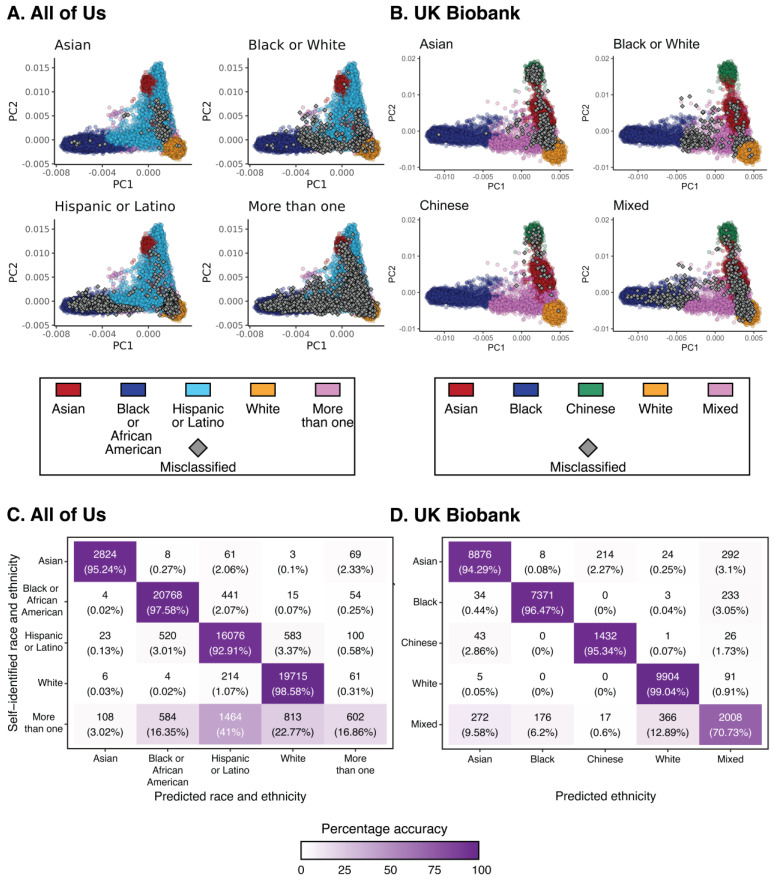
Figure 3.
Correspondence of biobank participants’ race, ethnicity, and pharmacogenomic PCA data stratified by groups. The locations of misclassified individuals (gray diamonds) in PCA space are shown for (A) All of Us and (B) UKB. Race and ethnicity prediction accuracy values are shown for (C) All of Us and (D) UKB for all race/ethnic group combinations. Each cell shows the number and percentage of predictions for self-identified (y-axis) versus predicted (x-axis) group combinations; cells along the diagonal correspond to accurate predictions.

