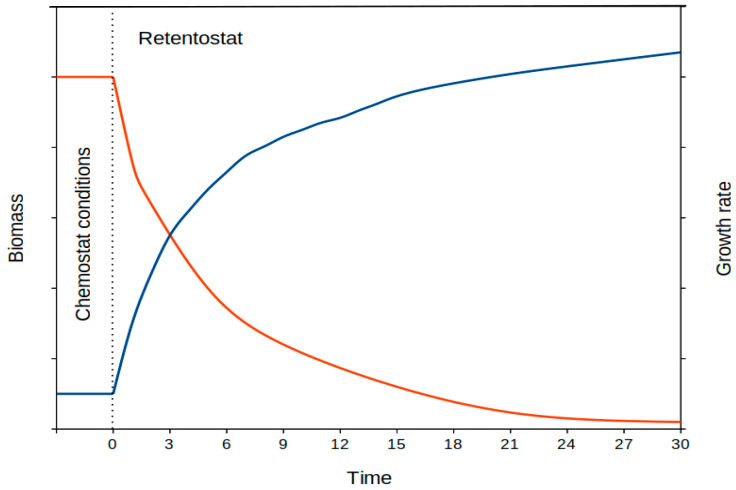
Figure 3.
Representation of the biomass and growth rate over time in a retentostat culturing system (with complete biomass retention) for a model microorganism. The progressive increase in biomass (blue line) over time follows a logarithmic curve model, which is used to estimate the actual growth rate (red line) of the cells at a given time point.

