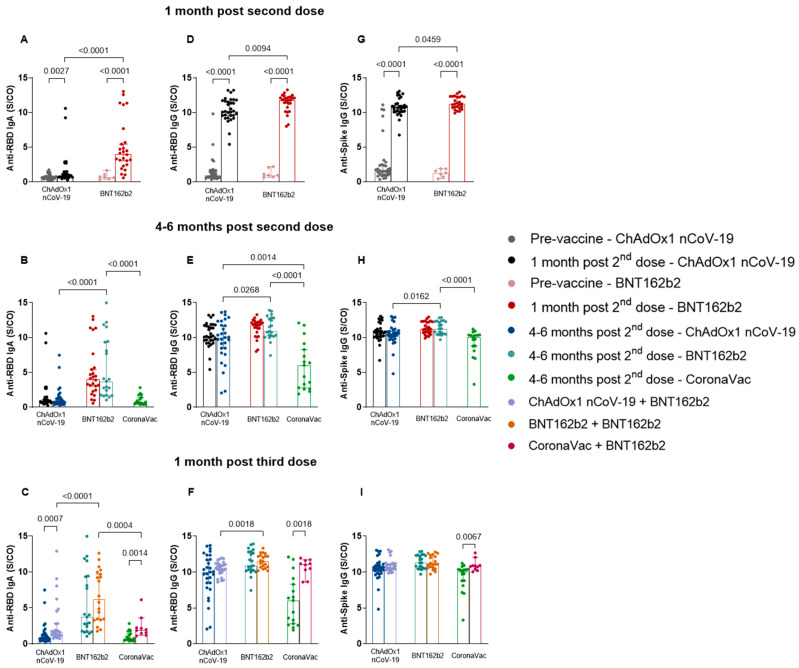
Figure 2.
Assessment of anti-RBD IgA and IgG and anti-spike IgG serum production at different time points of collection for ChAdOx1 nCoV-19, BNT162b2, and CoronaVac vaccines. Serum from individuals immunized with BNT162b2, ChAdOx1 nCoV-19, and CoronaVac was collected at T1 (pre-vaccine: BNT162b2 n = 7; ChAdOx1 nCoV-19 n = 32), T2 (1 month after application of the second dose: BNT162b2 n = 26; ChAdOx1 nCoV-19 n = 31), T3 (4–6 months after application of the second dose or pre-third dose: BNT162b2 n = 21; ChAdOx1 nCoV-19 n = 30; CoronaVac n = 17), and T4 (1 month after application of the third dose: BNT162b2 n = 20; ChAdOx1 nCoV-19 n = 26; CoronaVac n = 10). Antibody levels were compared between different time points: pre-vaccine and 1 month post-second dose (A,D,G); 1 month post-second dose and 4–6 months post-second dose or pre-third dose (B,E,H); 4–6 months post-second dose or pre-third dose and 1 month post-third dose (C,F,I). Detection of anti-RBD IgA (A–C) and IgG (D–F) and anti-spike IgG (G–I) antibodies was performed via the enzyme immunoassay (ELISA) described in the methods section. The results are expressed through the index calculated between the ratio: mean optical density (OD) of the sample/cutoff (S/CO-Signal/Cutoff). Each point represents a single individual. The end of the bar indicates the median value and the horizontal bars above and below the median indicate the 95% confidence interval. The Mann–Whitney U test was used to compare the indices of antibodies induced between the two vaccines. Statistical significance was adopted for p < 0.05.

