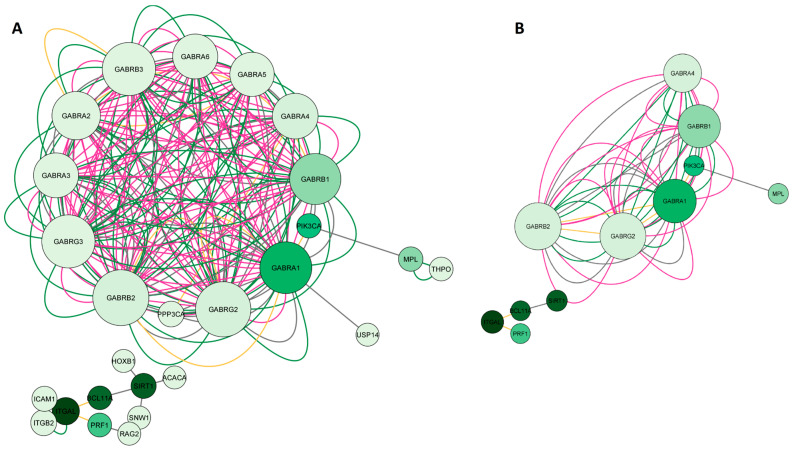
Figure 3.
Network construction of esketamine, suicide, and depression overlapping genes. (A) Complete network. (B) The filtered network based on the degree center (DC) > 2 and betweenness centrality (BC) range of 0.012–0.0667. The size of the nodes represents the degree of the node. The color of the edges represents the types of interactions. Physical interactions are represented in green, co-expression in yellow, shared protein domains in pink, co-locations in blue, predictions in gray, genetic interactions in purple, and metabolic pathways in black. This network shows the 11 most central and connected target genes shared among esketamine, suicide, and depression.

